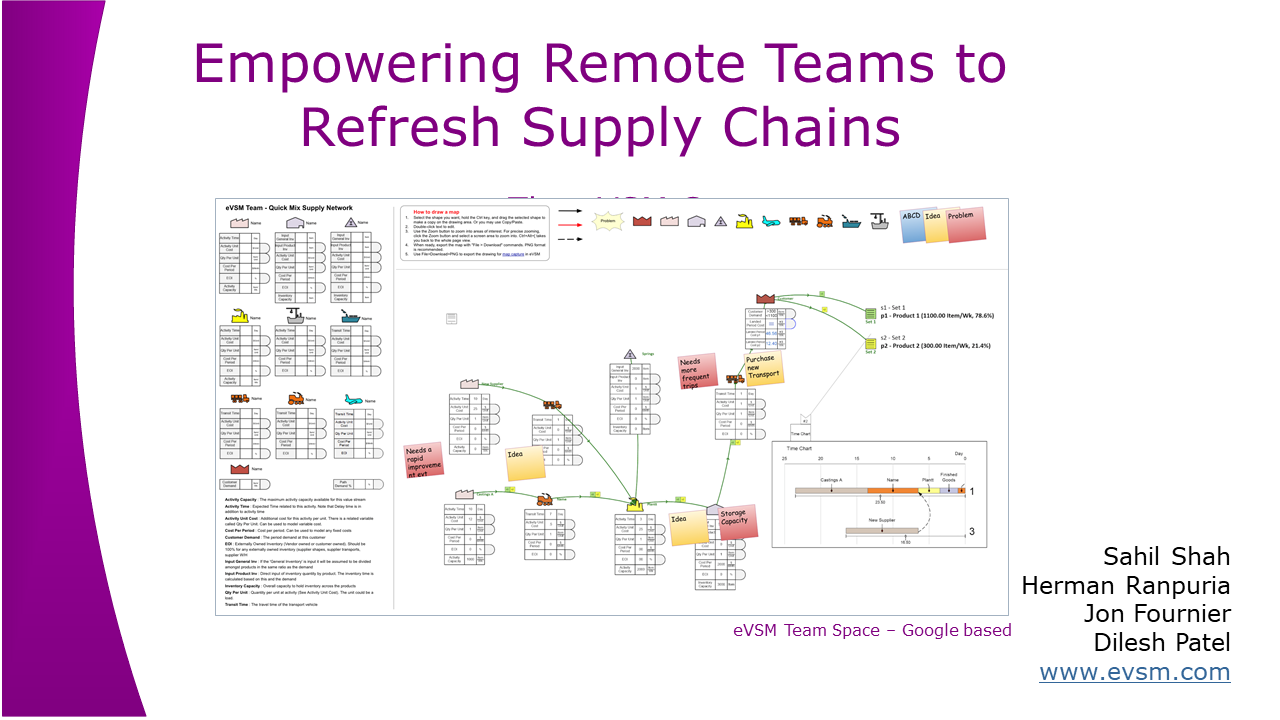
Welcome to a webinar on empowering remote teams to refresh supply chains. My name is Herman Ranpuria and I will be joined on the webinar by my colleagues Sahil, Jon & Dilesh. Our last webinar looked at remote VSM using a mixed model plant level VSM as the target for improvement. Today we will look at a higher level at a supply network VSM and how we might map and create improvement ideas for that while working remotely. If you attended our last webinar, the underlying multi-user Google-based technology (screenshot on slide) is similar but with one significant integration improvement. More on that as we get into the topic..
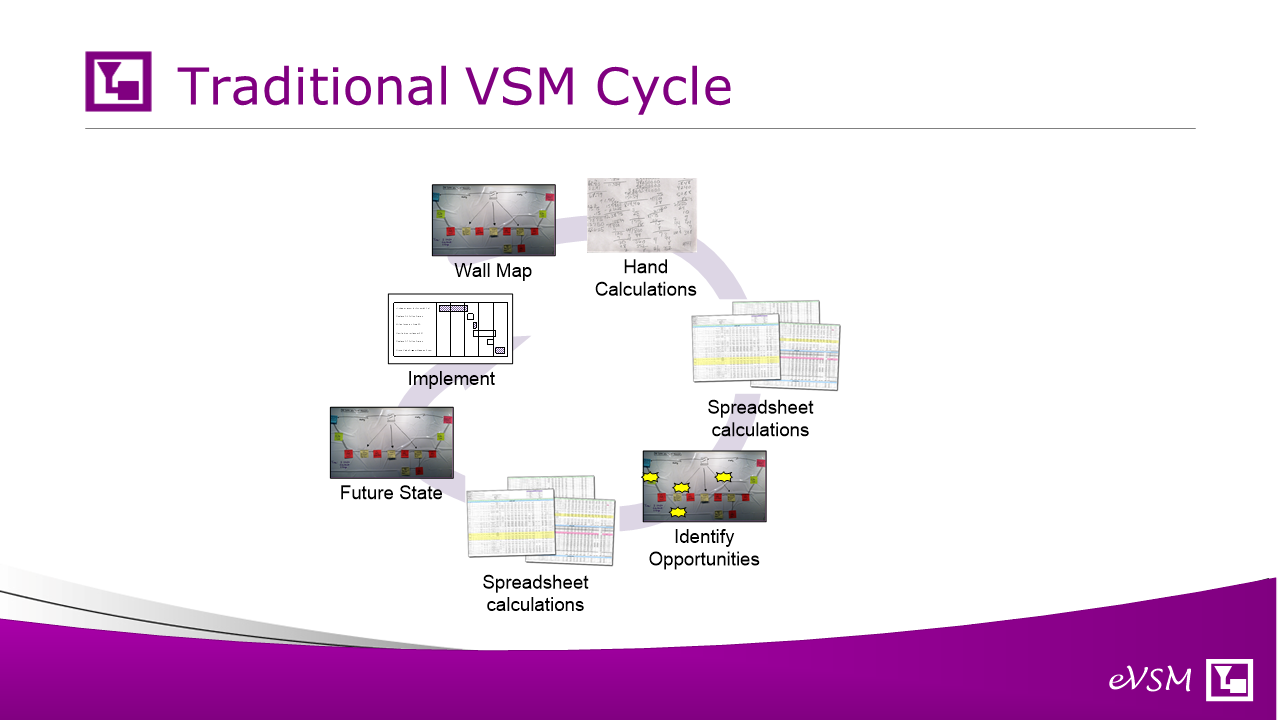
Let's start with looking at the traditional VSM event and improvement cycle. Something we have seen in many companies. It's a physical event that starts with a wall mapping activity with people gathered in a room. A value stream charter is created in advance. So the goals, start and end points of the map are clear and there are people in the room who are familiar with pieces of the value stream being mapped.
For a supply network VSM, we cannot literally walk the value stream so its crucial that there are people in the room who are familiar with pieces of the network being mapped. For a supply network we are dealing with concepts of flexibility, risk, inventory, lead time and landed cost. We are typically mapping a piece of the network, perhaps tied to a specific assembly or component and with a business problem at the back of our mind to guide the work.
Once we have mapped the current state, we start identifying issues and opportunities for improvement and ultimately leading to an improved future state map and an implementation plan for getting there. So let's look at the challenges of running improvement events like this in both co-located and remote work environments.
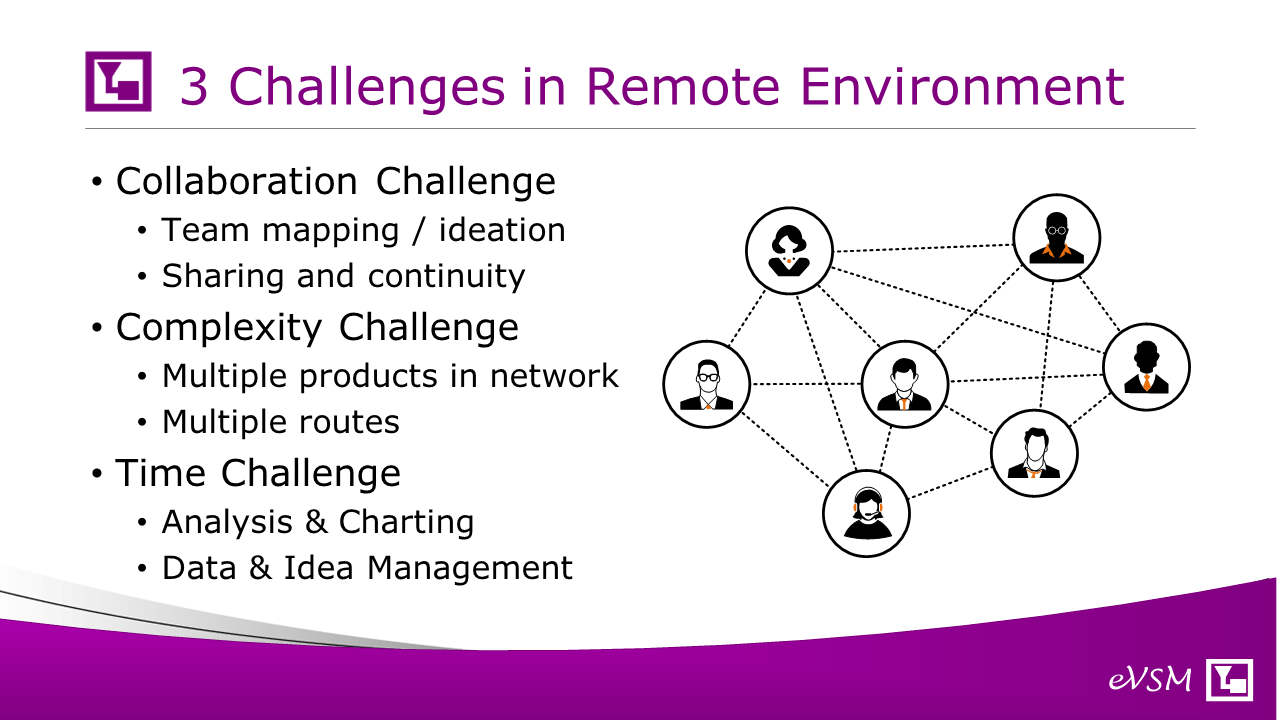
We can identify 3 major challenges.
The first is effective collaboration. There's a lot of goodness associated with getting people co-located in a room and having them brainstorm and come up with a map together. They can build on each others ideas and work concurrently on the wall with markers and post-its. So how do we do that in the virtual environment? And also there's an additional problem with sharing and continuity. We're not going to run a three day event in a virtual environment. Typically, we might break up in shorter sessions. So how do you assure continuity between sessions?
The second challenge is a complexity challenge. The network services multiple products and some with different routes even in the same product family. How do we visualize how the supply is working on the product variations and ideate on improvements to make ?
And finally, there's the time challenge. We are interested in metrics like landed cost, inventory and lead time as we make improvements. Its tedious to calculate these but necessary so we can see the impact of changes. We also have to manage all of the ideas somehow and move to decisions on what to do.
So we've talked about the challenges in our virtual environment and now let's look at what process we could follow to resolve these..

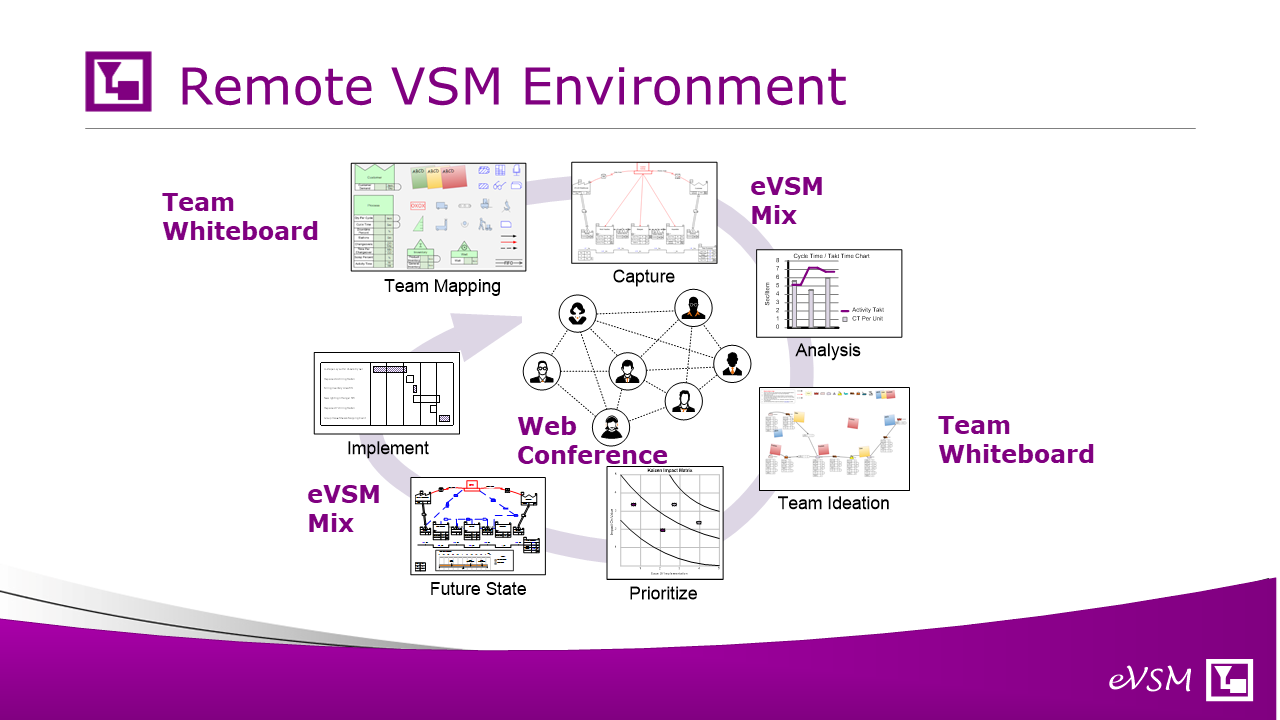
So imagine for a second that your remote environment had a whiteboard capability (Team Mapping in the diagram). So you all dialed in over the network and are chatting and creating the map on the whiteboard. It has the VSM icons with the associated variables all on there and you could draw with simple drag & drop. And you could work simultaneously just like you might be working with a physical board. This is would be your equivalent of the normal wall map activity.
Once you had a basic map you have a couple options to do the analytics. You can make an image copy and trace over it in the eVSM Mix software OR we have found a way where you can paste it into Google slides and a little macro my colleague has written will actually create a starting eVSM map for you. A great time saver and removes some of the grunt work. This is the Capture step in the diagram
eVSM Mix understands different products with different routings and different operational values so you don't have to create multiple maps or make lots of assumptions. You could use eVSM to complete any data input either directly or via spreadsheet interface. Now the analysis and charts would be just push buttons away (Analysis in the diagram).
Now you can make a copy of the map with analytics and visuals and paste it back onto the whiteboard for usage in generating improvement ideas (Team Ideation in the diagram). Ideas can be posted using the electronic post-it equivalents, color coded as needed. As part of the ideation, one of the team has the working eVSM map (or model) and can run what-ifs in response to ideas from the group. Once the group decides which ideas to pursue for the future state, the eVSM map can be copied and modified to become the future state, and an implementation plan created (Future State and Implement in the diagram).
Lets summarize what’s needed for the Remote Environment Setup next..
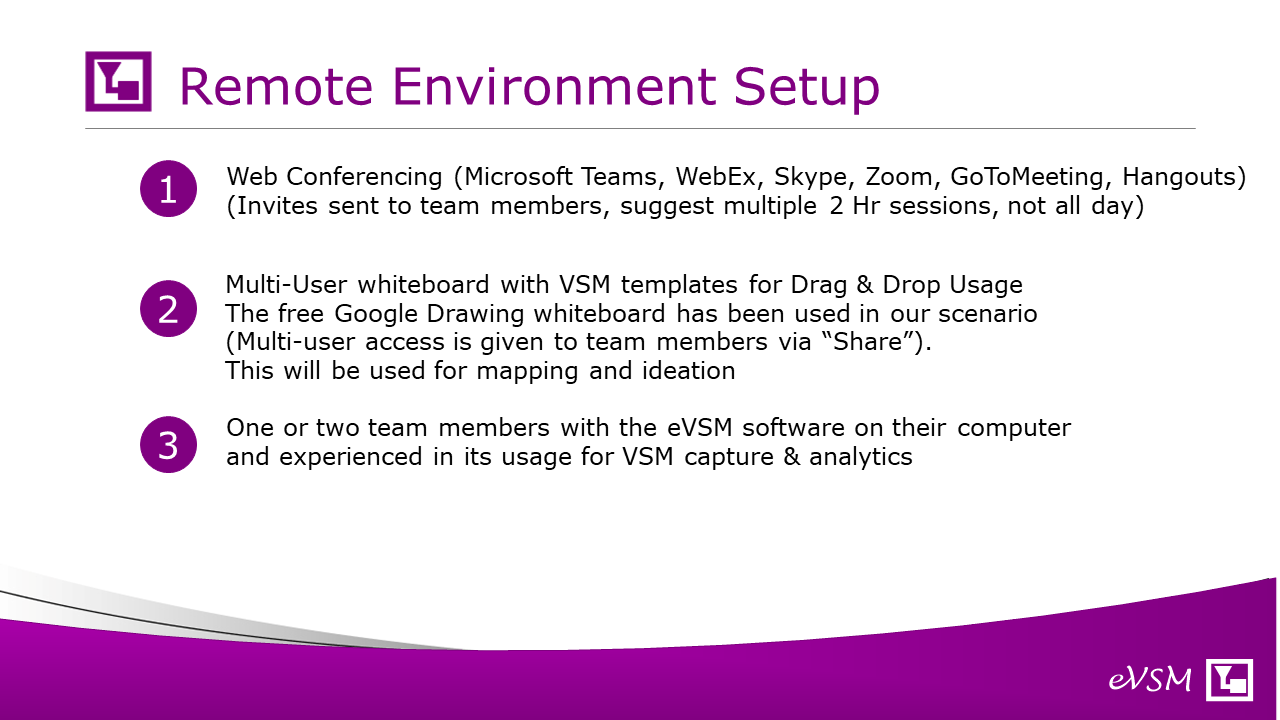
The remote environment for our remote team has 3 components
The first is web conferencing with screen share, audio, chat, video. Many providers here
The second is a electronic Team Whiteboard with VSM icons and corresponding data shapes that the team can use. This is a multi-user environment like Google Drawing. Our group uses Google Drawing and has pre-created the VSM templates for you to use in this environment. The whiteboard is shared with all team members
The final component is the eVSM Mix software itself and its only needed for one or two of the team members who will capture the map from the whiteboard and provide the analytics to the team for landed cost, lead time etc.. eVSM Mix can be used to capture the map from just an image of the whiteboard map but we have also built a data bridge from Google Drawing that makes capture faster and easier.
Lets look at a simple supply network scenario using this environment..
In our simple scenario imagine that we have been tasked with looking at the single source castings supply for our high demand medical cutters product family
Our supplier is having trouble meeting demand and so we get incomplete order fulfillment and sometimes have outages or need to resort to expedited transport to keep our assembly operations running
The knowledge we need is spread out in marketing, engineering, purchasing, logistics, and manufacturing so we have identified the team members and are going to run a virtual event to look at this aspect of our value stream.
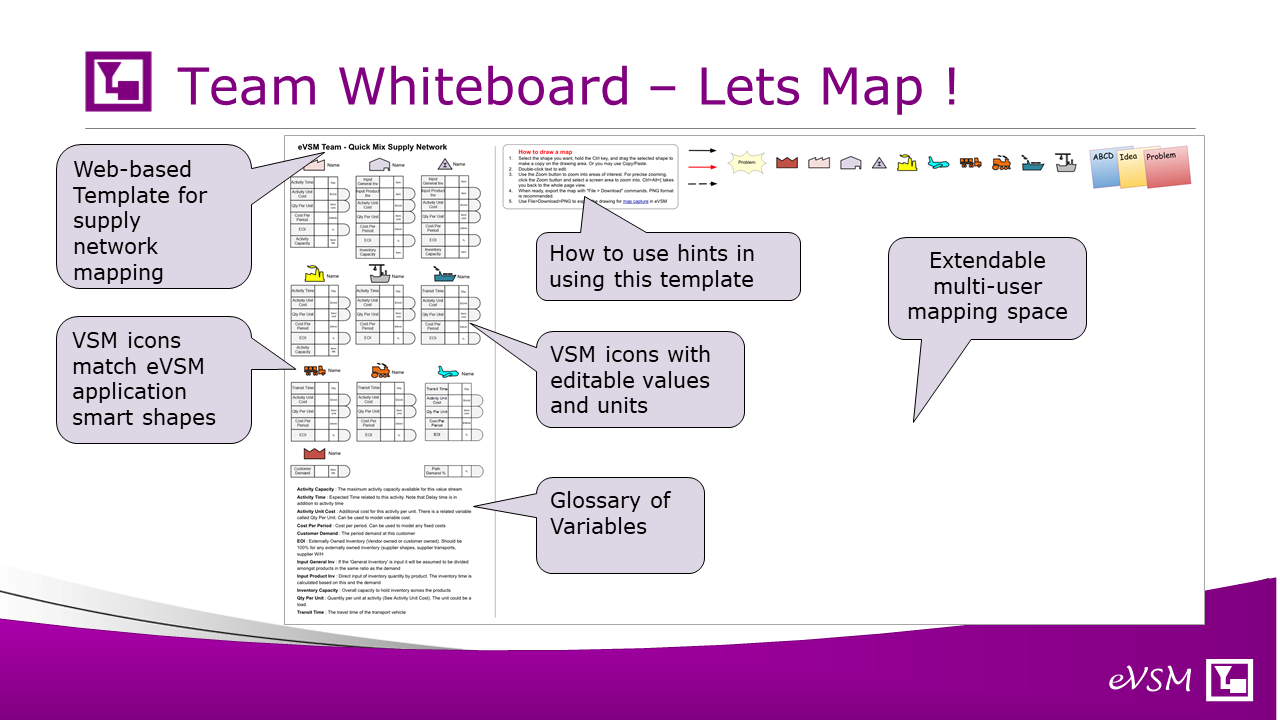
Here’s the collaborative team template to develop the current state map of the piece of the supply network we are concerned with. The data boxes have the demand, cost, time, inventory aspects that are important to us. We can make this template accessible to team members by sharing it with them using their email info. They can then all help us create the map and enter in the values, just as they might do in a physical meeting and using a wall map
A few things to note on simplifying usability of this by team members:
First, the template should be very simple to use so that all team members can contribute. For our Google Drawing template we have added simple instructions on the template itself and would recommend giving the team a few minutes to read these and play with the template before starting
Secondly, in addition to VSM icons with attached data shapes, we have also included just the basic icons themselves. Sometimes you are sketching the value stream and the data in not yet available. In this environment the blank data boxes can get in the way
Finally, note that we have a glossary of the key variables on the bottom left. Just to further reduce any confusion.
Lets start working on our simple scenario..
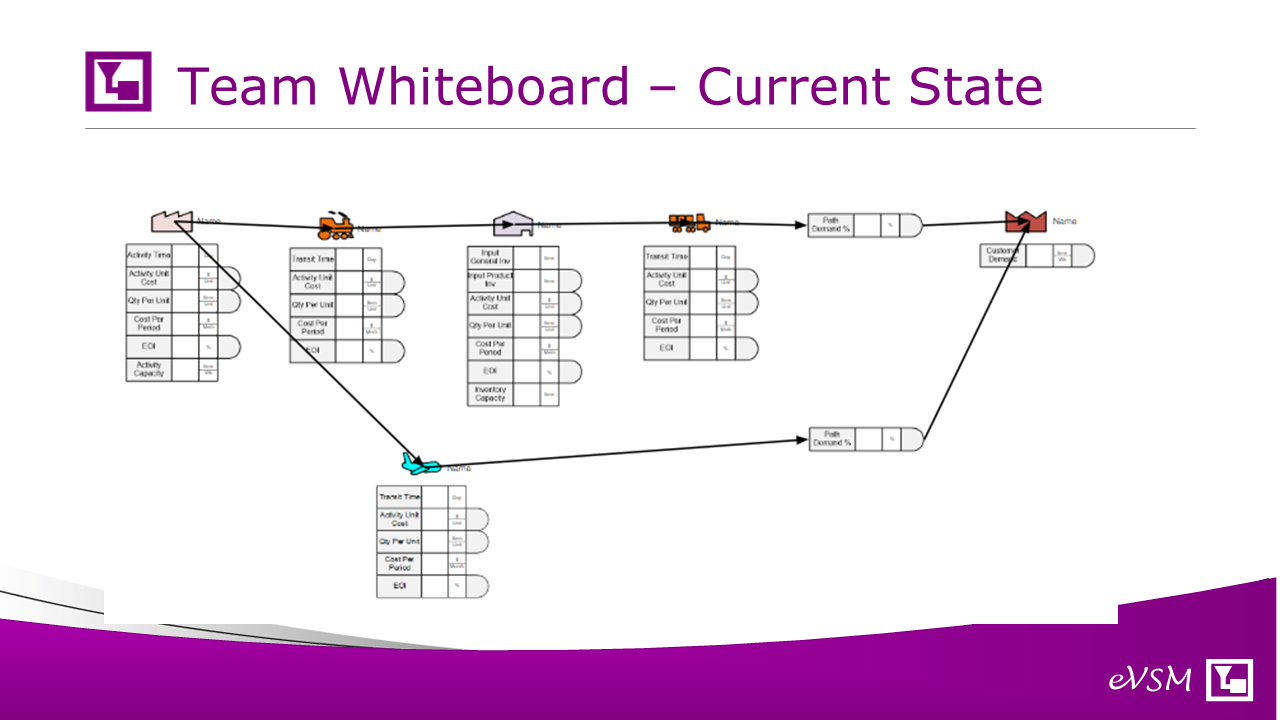
Here’s a quick sketch of the current state and before input of the related data. The sketch took a couple of minutes in Google Drawing. Here’s a video showing the map being drawn in Google Draw.
The family has 3 products and the data values differ slightly, so the map can be copied a couple of times and the group can start filling in the related data on demand, cost, inventory, time. This is where the ability to work together on a map is a real advantage. We can keep the map copies on one or separate drawings.
Once the data is filled in, the map can be taken into eVSM Mix by the team analyst and the key metrics can be calculated. In this example this would take 15 mins or so and then the analytics could be shared via screen sharing on the web conference. We have a little macro in Javascript that can bring the drawing data across to eVSM using Google Slides as a bridge. Contact us if you would like that. The other options is just to take an image over to eVSM and sketch over the top of it.
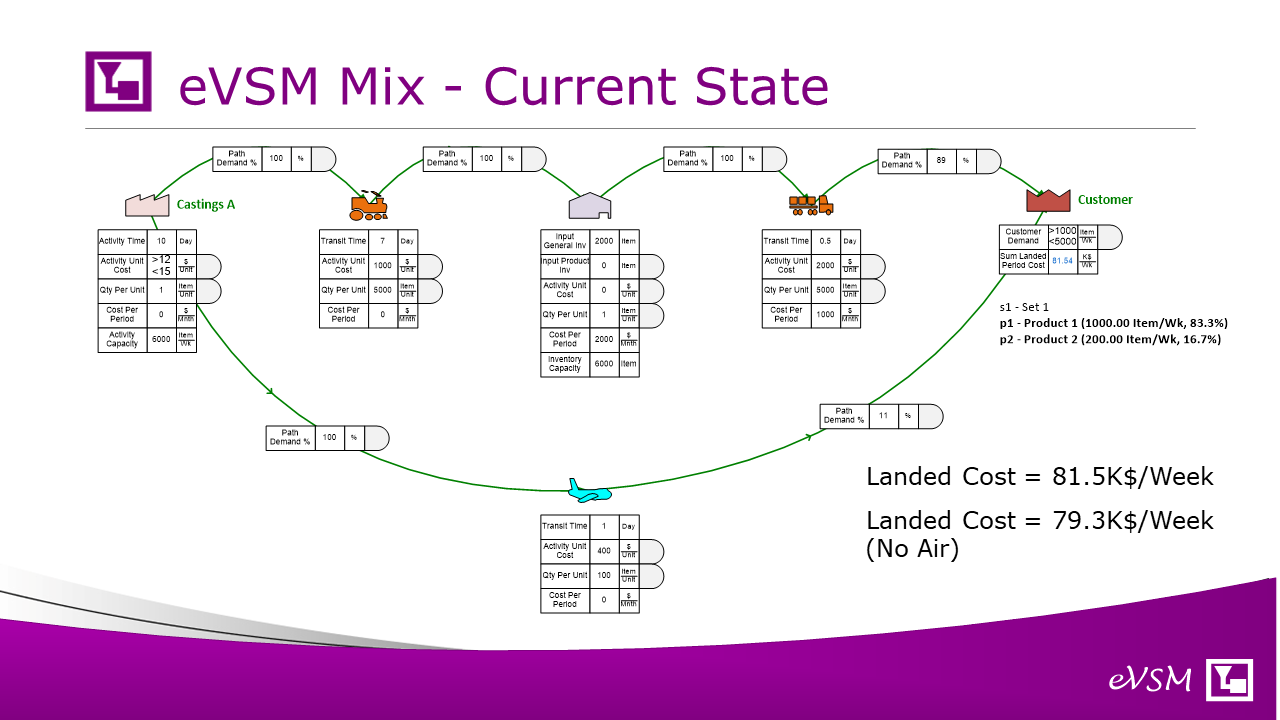
Here’s the map in eVSM Mix and a video showing a quick “what-if” analysis to help the team understand the cost impact of the air expedited transport.
The team member running eVSM would be sharing the screen on web conference so the team could request basic “what-if’s”
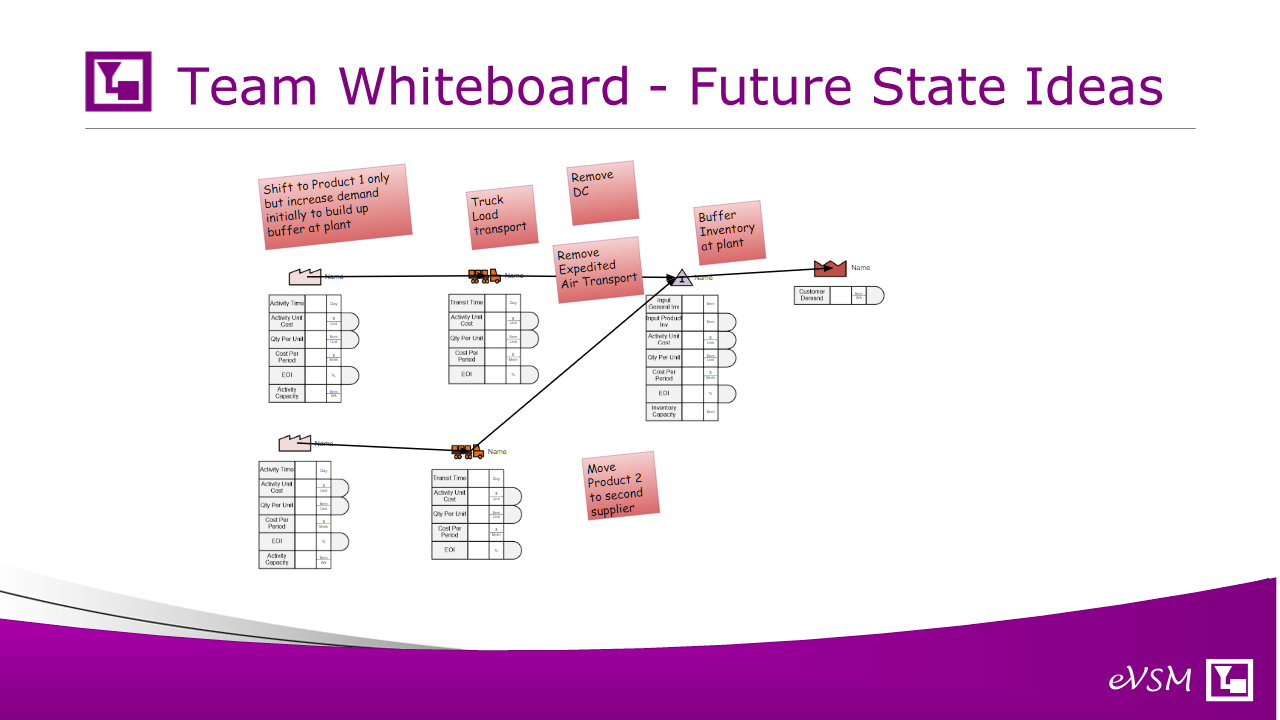
The team is looking at improvement ideas and have put a few of them on the team whiteboard
The concept is to reduce the demand at the supplier by moving product 2 to a separate supplier
Also to reduce outages by having a buffer inventory at the plant and with reduced lead time by truck shipping directly from the supplier
The goal is to reduce or eliminate the need for expedited transport
The team enters the data for the scenario on the whiteboard and requests an analysis in eVSM Mix
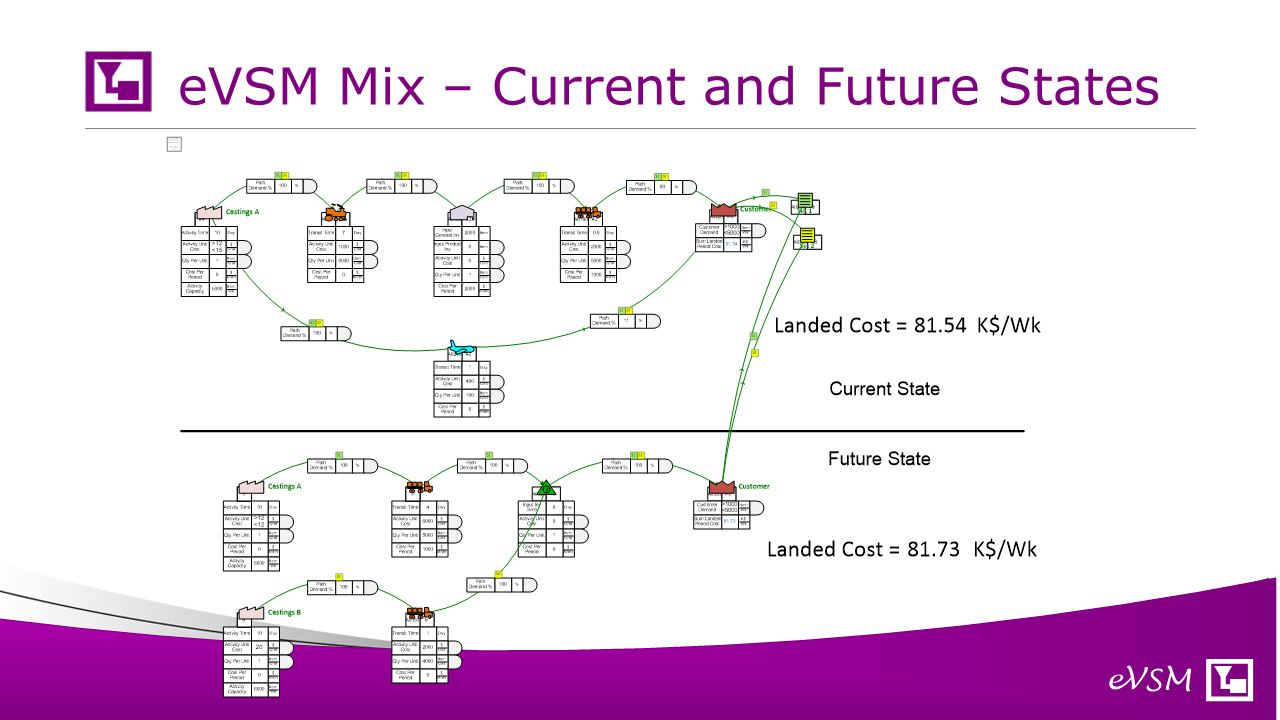
Here are the current and proposed future state as analyzed together in eVSM. The higher piece part cost at the second supplier is offset by the elimination of the expedited transport. Note the green/yellow squares on the arrows showing the routings for each of the two products in this scenario
The analysis can be detailed further once the buffer inventory quantity is determined to take into account holding cost but this is likely to be lower as the DC in the current state has been eliminated
The team can request various “what-ifs” on the model for different demands, tariff rates, supplier costs etc..

This simple scenario showed how we tackled the three challenges
The first was effective collaboration. We used a combination of web conferencing with a team whiteboard that had an integrated VSM template for our purpose. The template could be learned in minutes so the whole team could work with it simultaneously
The second challenge was a complexity challenge. We created separate maps for the primary products on the whiteboard but were able to combine into a single map in the eVSM software with color coding
And finally, there's the time challenge. eVSM Mix automated the analytics and “What-If’s” for us and let the team explore metrics with options.
These are difficult times, but with approach’s like this we can continue to take care of our business. We need to adapt the legs of our supply chain to respond quickly and effectively.

eVSM TeamSpace Google Drawing Templates
See Google Drawing Templates at https://evsm.com/evsm-team-space-templates