The eVSM Software helps draw, analyze and improve MIXED MODEL value streams. Its used to accelerate lean deployments and returns from improvement efforts.
It’s a solution used by over 25,000 improvement professionals worldwide over the last two decades.
In this video, see how quickly a mixed model plant map is captured in eVSM.
eVSM supports the full continous improvement process
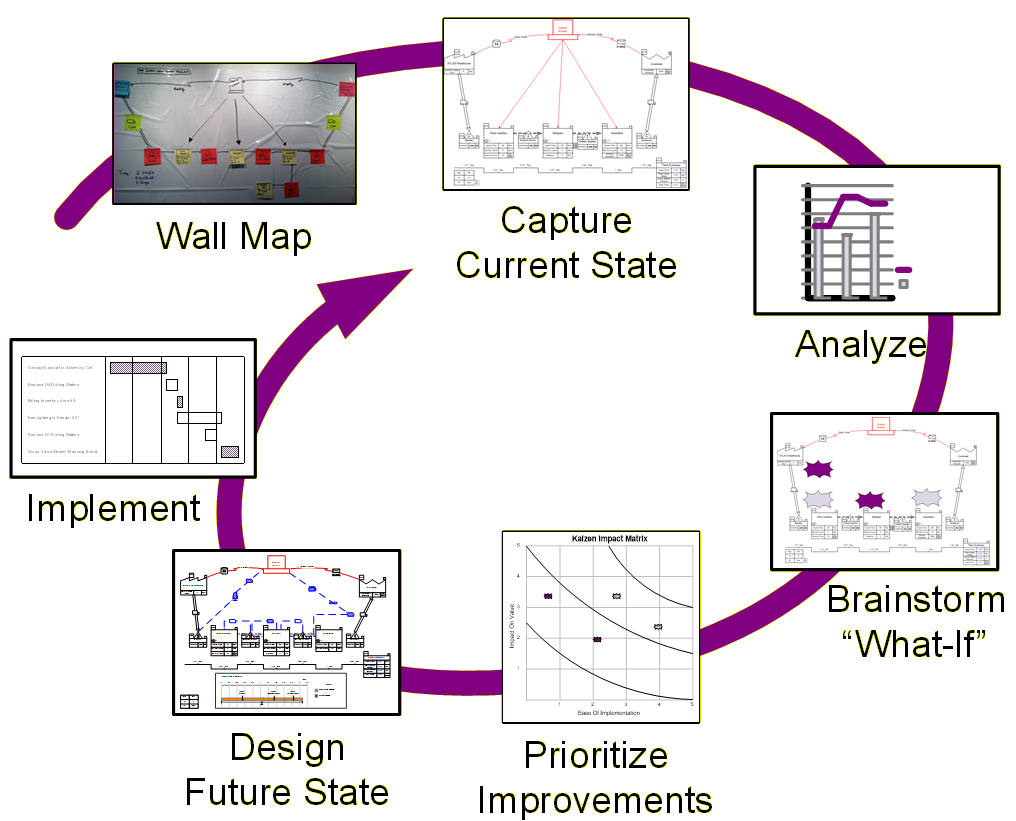
The eVSM software supports every step in the improvement cycle shown on the right. The end result is a VSM model that is easy to share, easy to reuse, easy to analyze. Contrast this with the paper output of many VSM events.
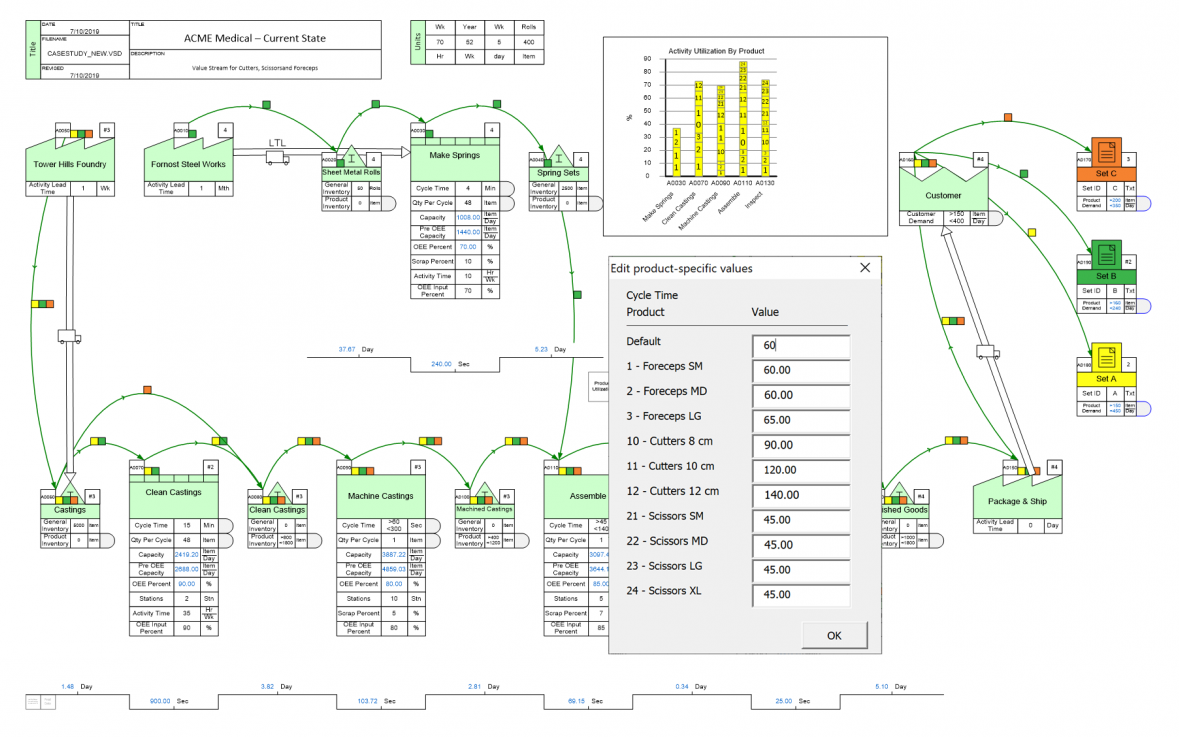
eVSM maps mixed model value streams
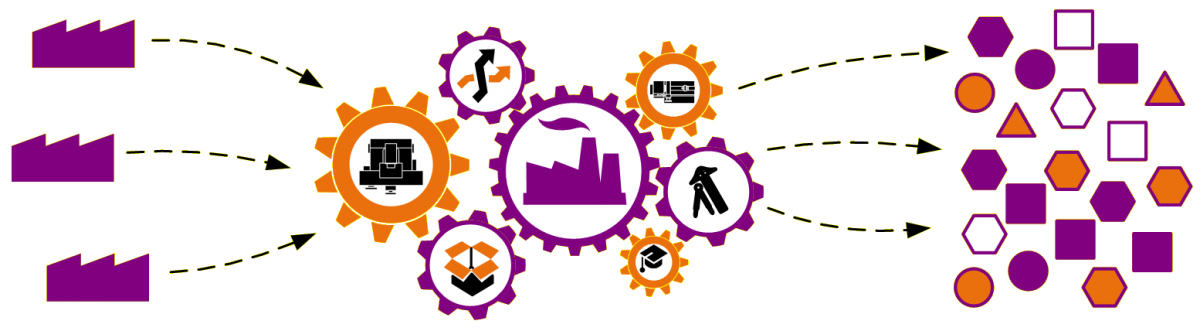
Use eVSM to map and improve mixed model value streams. These are value streams that produce multiple product variants through shared resources at the plant or network level.
eVSM has innovated a unique and simpler approach to these Mixed Model value stream maps. The approach leads to master maps instead of having to create and maintain multiple maps for different products and families. It removes all the averaging and guesswork after the multiple maps are created also. 95% of value streams are Mixed Model today. See a map being created from scratch in the 15 min video below
eVSM maps every value stream type
eVSM has standardized comprehensive automated MIXED MODEL mapping applications for the three primary VSM types (Production, Network, Transactional) and lean tools in addition for VSD (value stream design) work.
Each eVSM mapping application has a centralized resources page that describes the application and provides on-line learning resources

Plant VSM

Supply Network

Transactional VSM
Time Mapping

Lean Design Tools

eVSM Extras
eVSM has pre-set variables, equations, and charts
Our clients (including those in the Fortune 100) have dropped internal development of VSM tools and are using Standard eVSM. 99% of our users only use the preset variables, equations, charts because these have become a global standard.

Standard Icons
Standard Variables

Standard Equations

Standard Charts
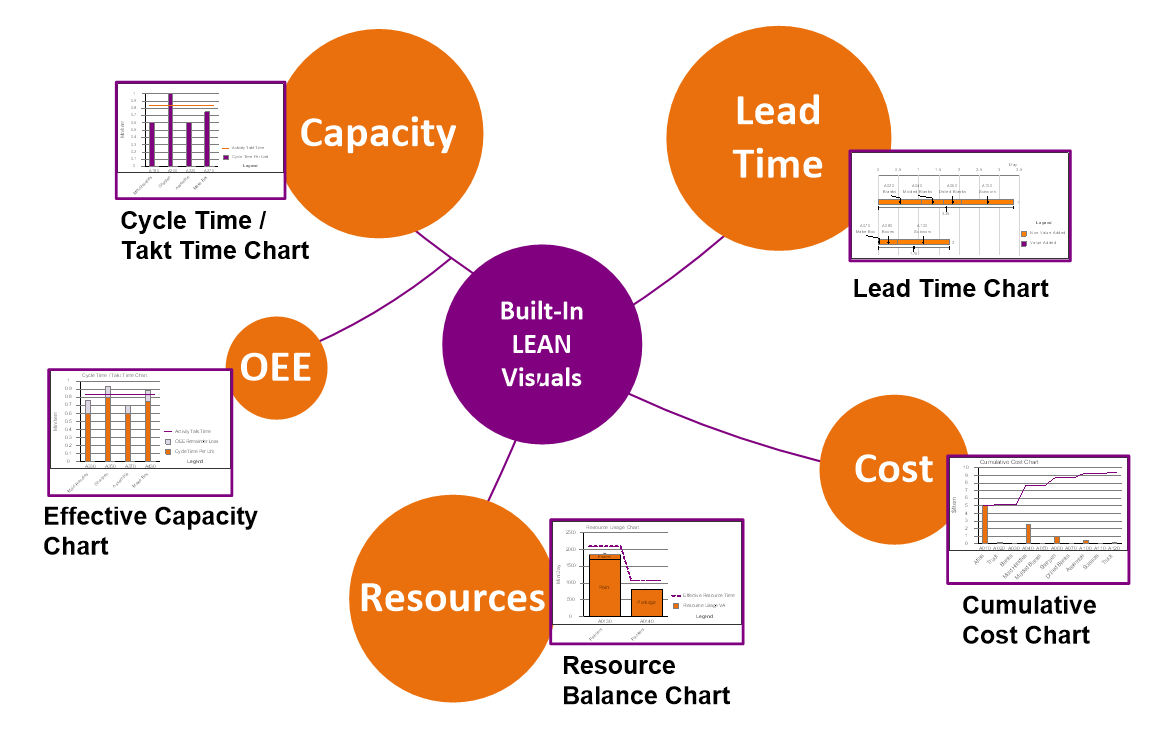
eVSM allows creation of visual maps and dashboards
A value stream map helps build consensus on how the value stream operates, highlighting key metrics and identifying the most impactful improvement opportunities.
This is best achieved through visuals such as cycle time/takt time charts, lead time charts, and resource balance charts. eVSM enhances this with color-coded gadgets to pinpoint high utilizations, and line thickness indicators to visually represent flow quantities and cost along the value stream.
It’s the easiest way to visualize the value stream.
eVSM is backed by eLearning and expert support

eLearning is available for each of our mapping applications.

Facilitated on-line, on-site, on-demand training/map services are also available to accelerate adoption of eVSM by improvement teams and ensure success of the initial VSM activities.
What do my peers think of eVSM?

Brad Campling
Stream Improvement Services
"With the new eVSM Mix software, we can build mixed model maps to capture variations in process flow, cycle time and other critical process parameters for the product family. This allows us to use real demand scenarios to [see or quantify] the impact on the entire value stream in terms of resource capacity, lead time and line balance. The Mix capability is the greatest thing to happen to value stream mapping since the original eVSM software.”