Lean Design Tools

Lean design tools including spaghetti diagramming, quick changeover, plant milkrun design, kanban calculation and project planning. Note that applications designated with an asterisk(*) are only available in eVSM Mix and not in eVSM Standard.

Spaghetti Diagram

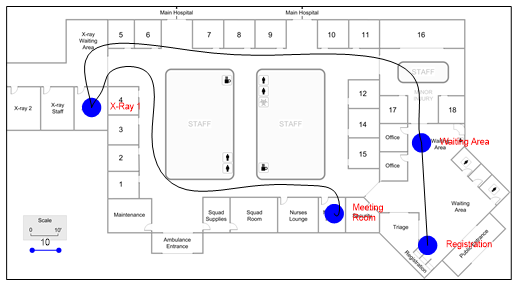
Example spaghetti diagram created simply with drag and drop and with automatic distance calculation

The Spaghetti diagramming application allows you to draw paths on a floor plan and then export a Path Report with distances to Excel.

Example Tutorial

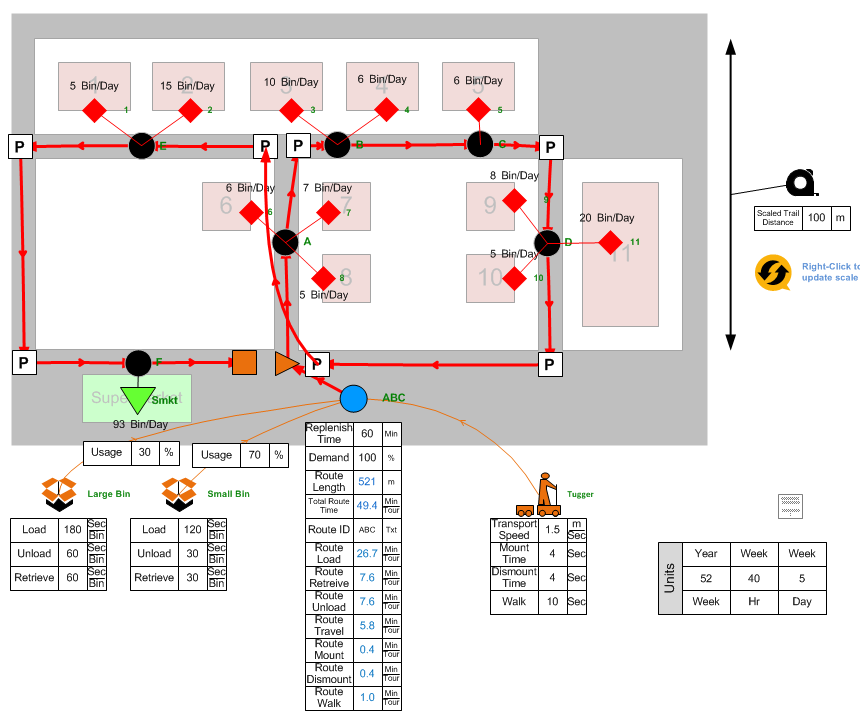
Plant Milkrun*

Example Plant Mikrun map that allows design of material delivery routes and replenishment periods within a plant via overlay sketching on floor plan with calculation of travel times, load times, and unload times. Allows usage of specific transport types and one or more standardized containers per milkrun.

The Plant Mikrun application allows design of material delivery routes and replenishment periods within a plant via overlay sketching on floor plan with calculation of travel times, load times, and unload times. Allows usage of specific transport types and one or more standardized containers per milkrun.

Example Video

Changeover*

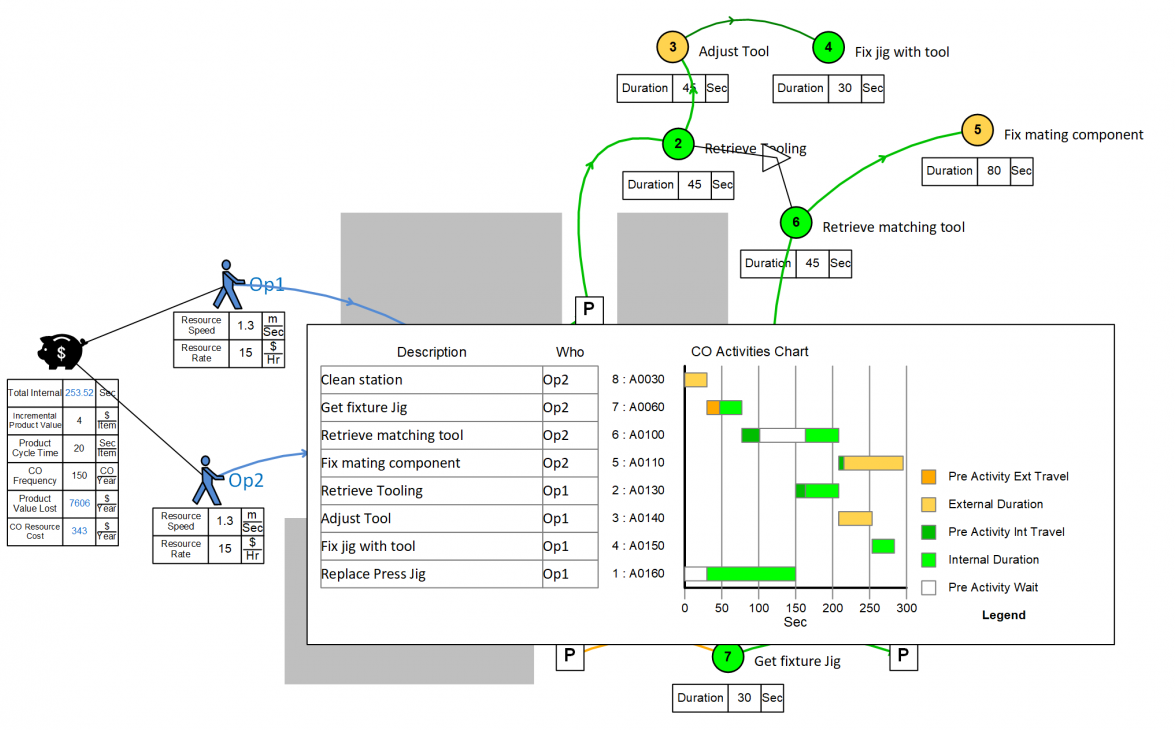
Example digital quick changeover map with supporting analytics

The Changeover application allows analysis of converting a line or machine from running one product to another with calculation of walk times, work times, and separation of internal and external work components. Also computes cost of product capacity lost during changeover. Supports changeover work content from multiple staff. Generates C/O work chart with timings.

Example Tutorial

Kanban

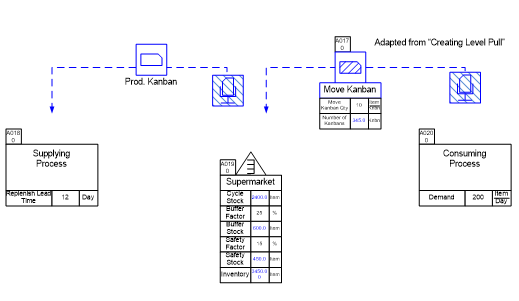
Example of Kanban sizing and quantities for a simple Kanban loop and using safety factors against demand variation and supply issues.

Calculates Kanban sizing and quantities for a simple Kanban loop and using safety factors against demand variation and supply issues.

Example Tutorial

Project Planning

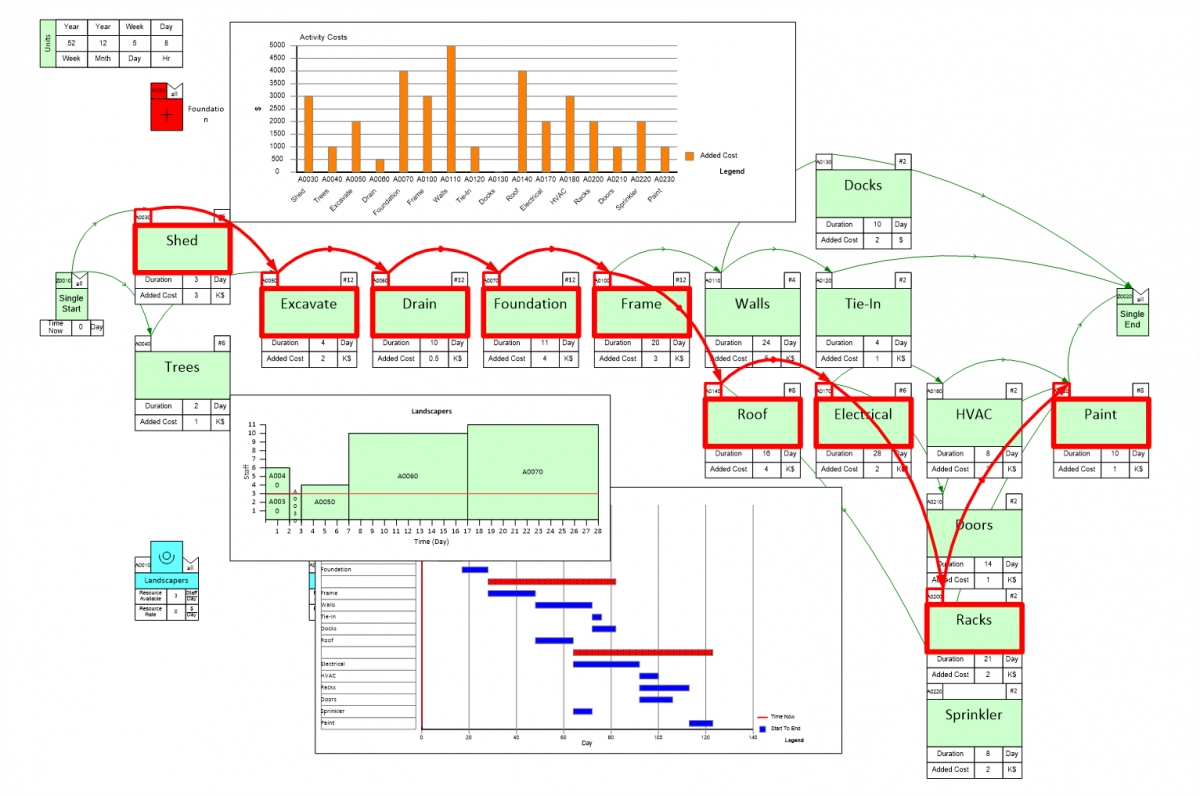
The Project application allows visual project planning and scheduling with start/end constraints and associated resource usage and costs. Automatically generates a Gantt chart and allows highlighting of the critical path.
Details

Standard Work

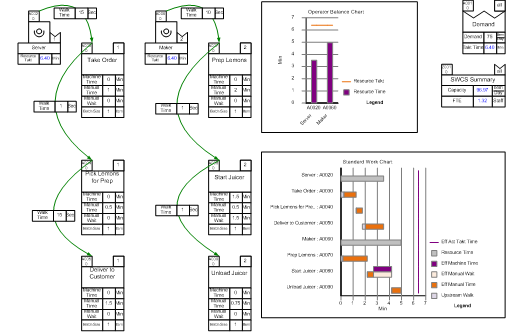
Allows layout of standard work with manual, machine and walk times and creates a standard work chart.

Example Tutorial

A3 Report

The A3 application creates A3 Reports in Visio with a starter template and a dedicated stencil of standard shapes from eVSM.

Example Tutorial

VSM Dashboard

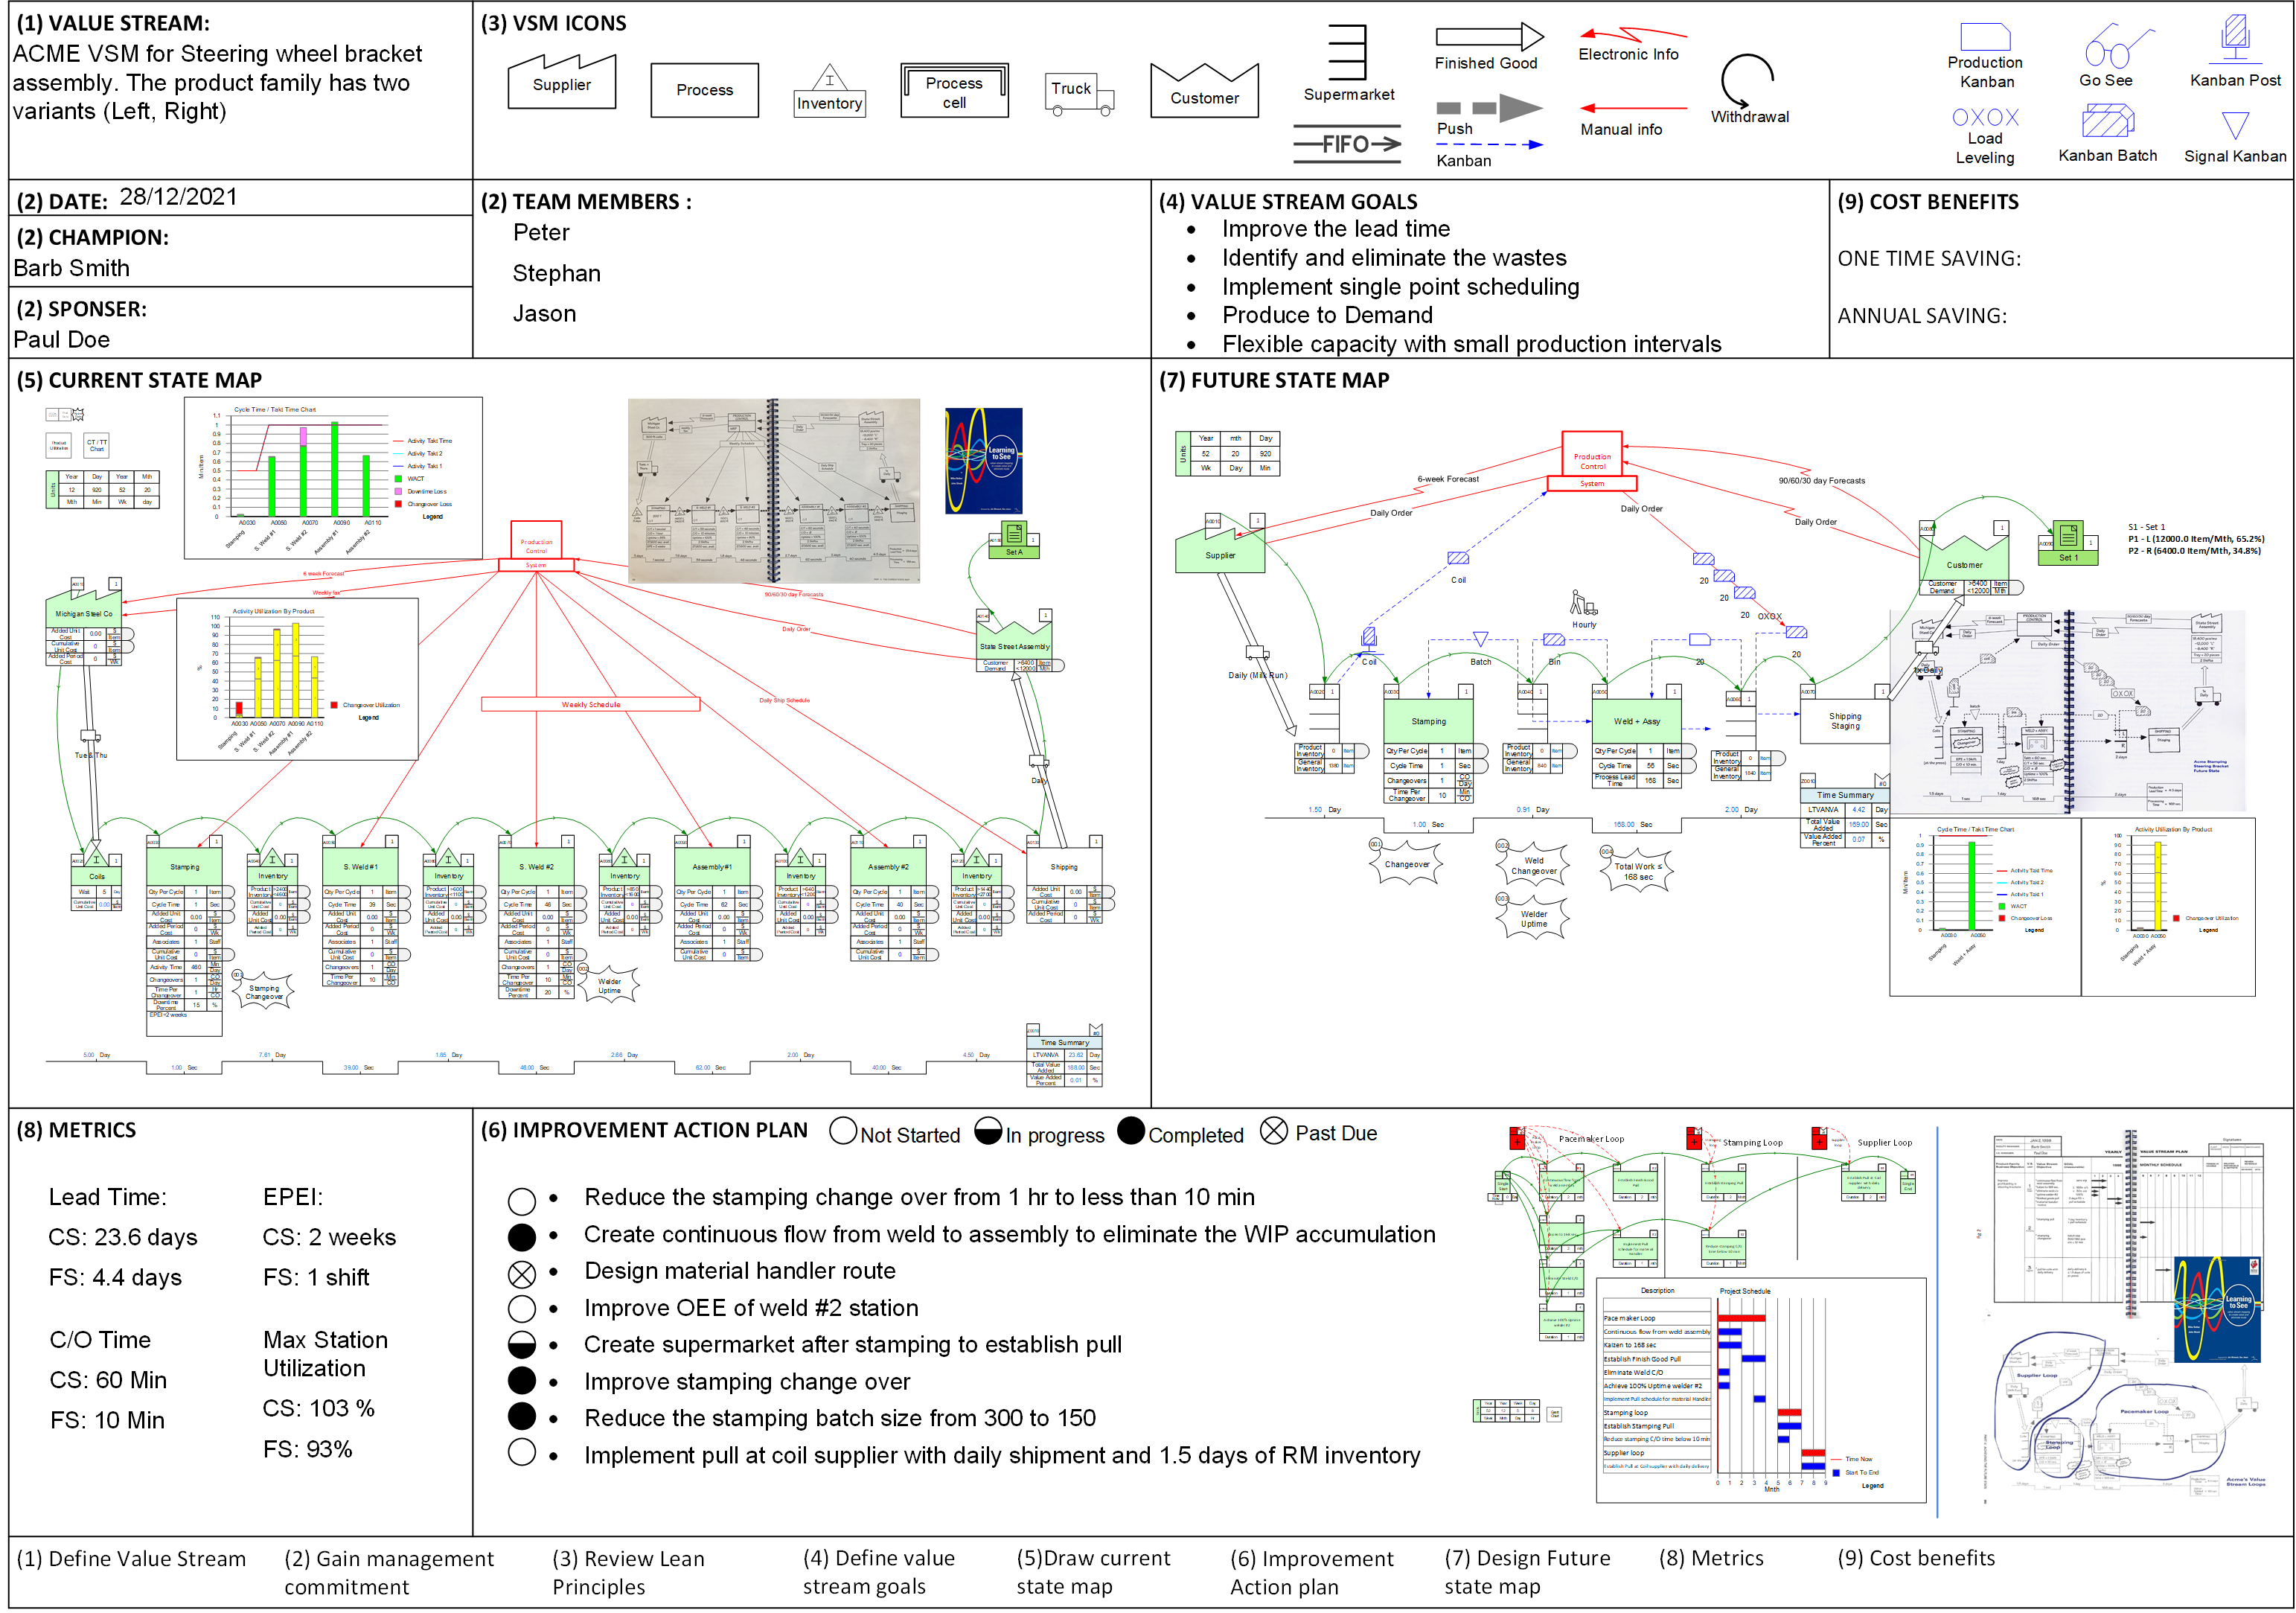
The VSM dashboard template allows presentation of the plan going from current to future state and subsequent printout or posting to digital screen. See its example application to the case study from "Learning To See" below.

Example Tutorial