eVSM Mix comprises a series of visual mapping applications with built-in analytics.
The applications use a common toolbar and have a common underlying mix model engine.
This page will give you a high-level view of the improvement process that most of the eVSM applications support and a peek into getting the most from the engine.
eVSM Mix – Supporting the Improvement Process
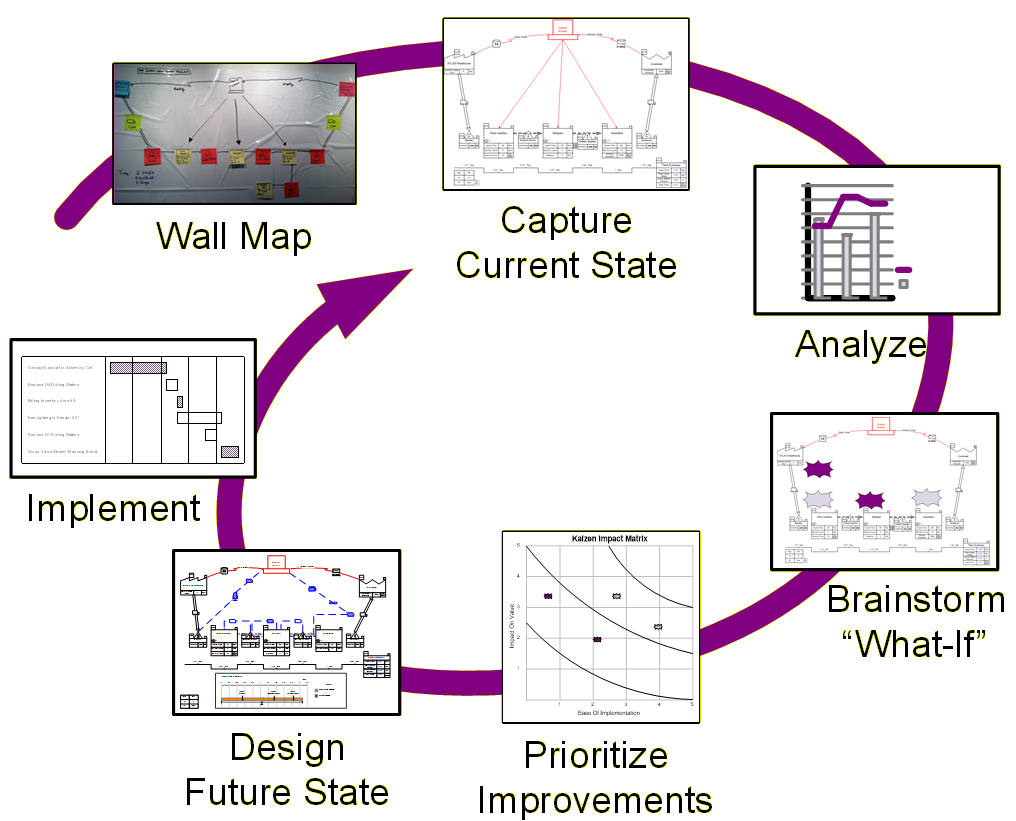
eVSM Mix is designed to support all the steps in the improvement cycle shown on the right.
It starts with physical (or electronic) wall maps and finishes with an implementation plan of the improvements.
The maps created are electric assets and can be applied for what-if studies and reused. This further accelerates the improvement effort and gets better payback from the time invested.
The panels below discuss eVSM’s support for each step
Step 1 : Wall Map
Use eVSM to map and improve mixed model value streams. These are value streams that produce multiple product variants through shared resources at the plant or network level.
eVSM has innovated a unique and simpler approach to these Mixed Model value stream maps. The approach leads to master maps instead of having to create and maintain multiple maps for different products and families. It removes all the averaging and guesswork after the multiple maps are created. 95% of value streams are Mixed Models today. In today's environment, it may not be possible to get together physically to create a wall map. We have provided an alternative remote VSM environment to mitigate this. See the blog below:
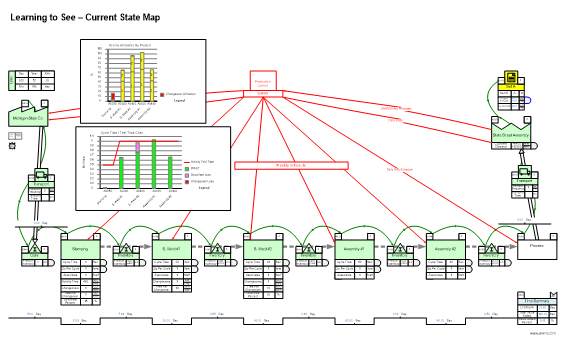
Step 2 : Capture current state
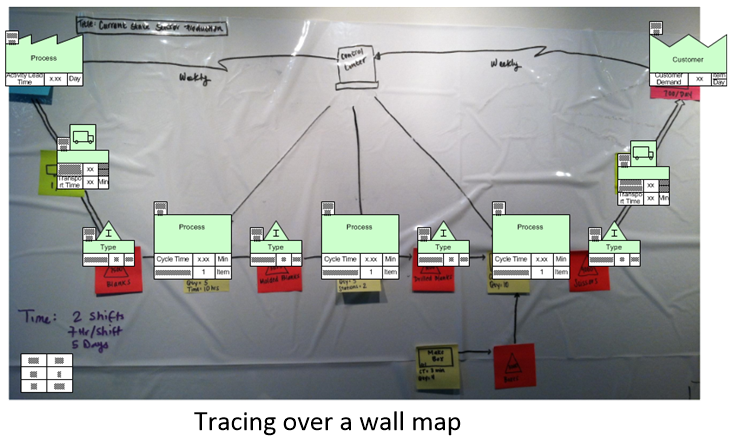
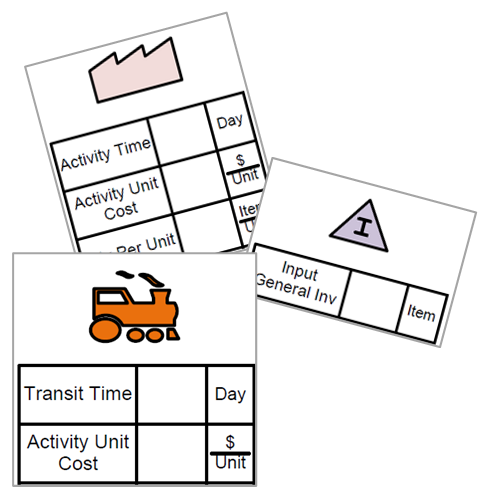
Once you have a starting map you make a digital copy. With a physical map, this would be a camera picture. eVSM provides a “wall map” button to bring in the picture, fade it a little, and then sketch over it to accomplish the capture.
If eVSM paper or electronic templates were used in the wall map creation, the capture is very fast because there are matching icons and data shapes.
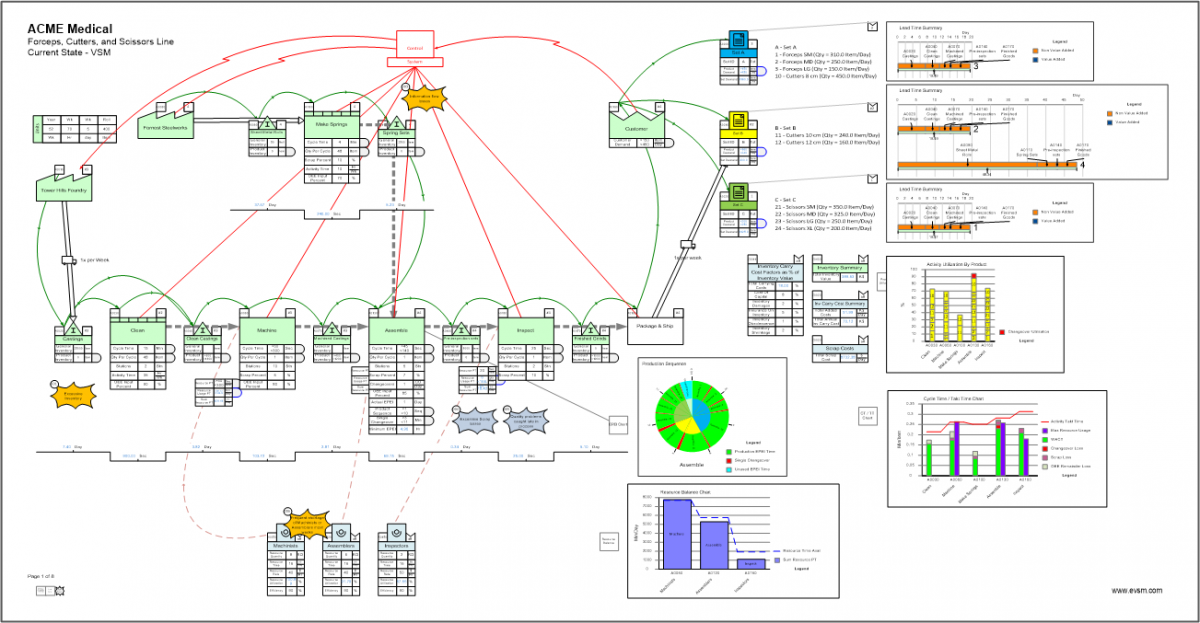
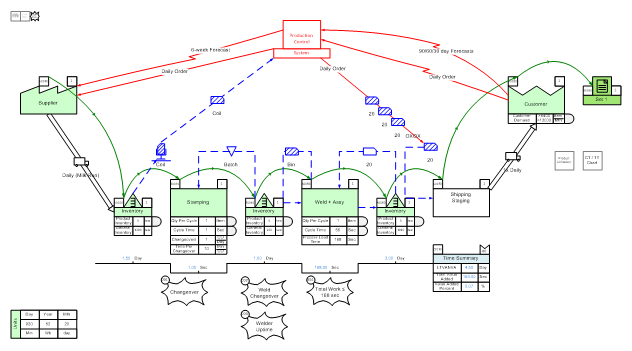
Step 3 : Analyze
Analysis of the value stream map helps calculate some of the key lean metrics that help with waste identification.
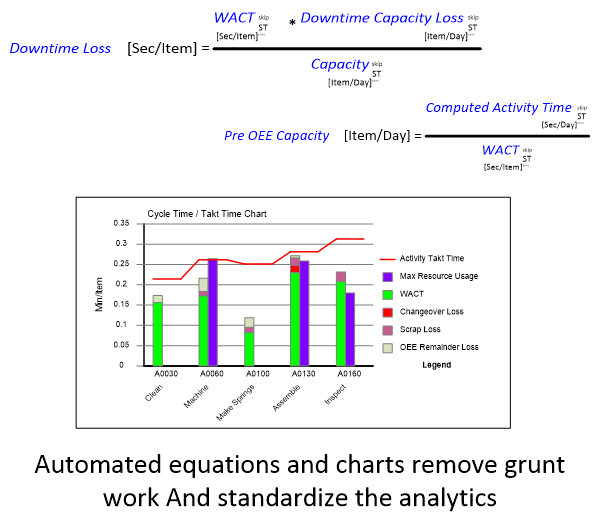
eVSM standardizes the input variables and then uses them with automated equations and charts to remove much of the grunt work in the analysis phase. The team can pick the best improvements and even do “what-if” studies to validate them.
Without automated analytics, it's tedious to calculate the lean metrics, so the team may make more use of gut feel on what to improve next.
Step 4 : Brainstorm “What If”
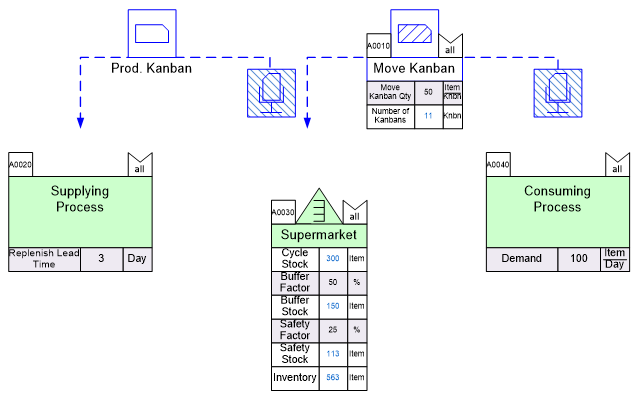
Once you map the value stream you can look at all the areas where flow is being hindered, think of areas where one-piece flow is possible, and design pull systems where it is not. All while meeting customer demand and balancing the value stream for efficient production.
Publications from the Lean Enterprise Institute (like “Learning to See”, “Creating Continuous Flow” and “Creating Level Pull” provide case study examples and a systematic approach to identifying the opportunities and investigating them.
The methods in these publications all require design tools like spaghetti diagramming, kanban calculators, EPEI (every part every interval), Bottleneck identification, loss analysis, material milk run, and line balancing. eVSM includes these tools so “what-ifs” can be done to explore improvement ideas and their overall impact on the value stream.
Step 5 : Prioritize improvements
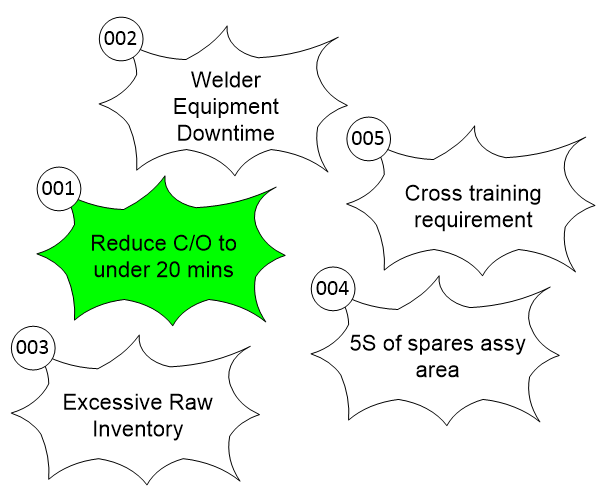
Opportunities can be identified on the map using kaizen bursts.
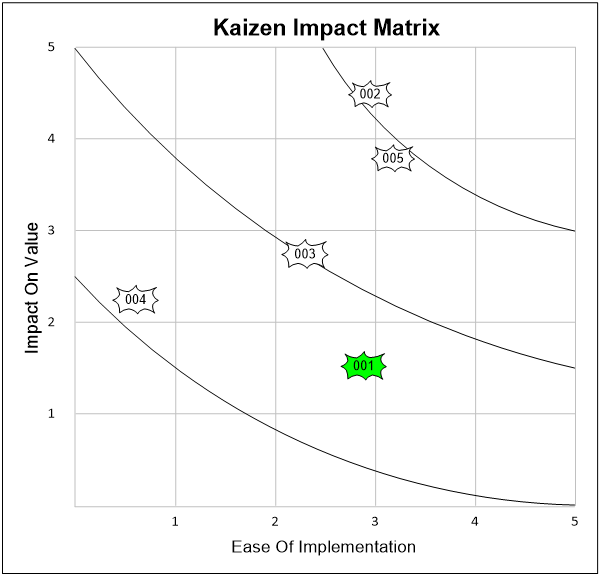
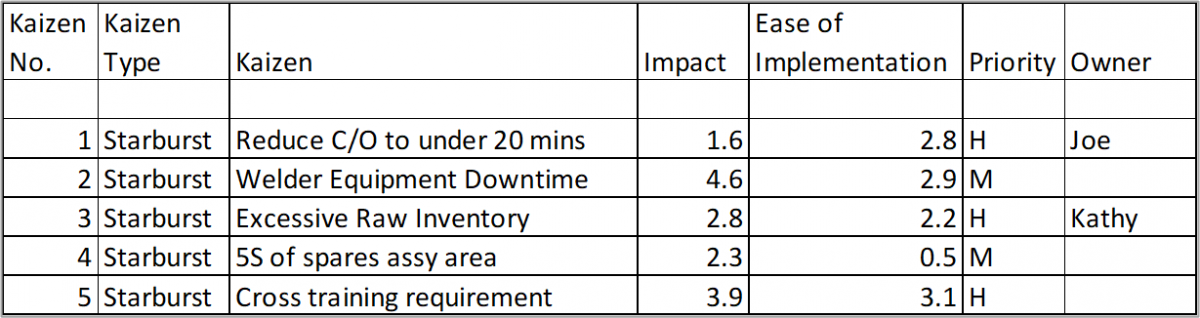
The kaizen bursts can have associated properties like owner, date, severity, and cost savings in addition to a detailed description
Two popular properties are ‘impact’ and ‘difficulty of implementation’. These can be used to plot an impact matrix to facilitate the selection of the improvements to go after
Kaizens can be collected and refined via import/export from an Excel worksheet
Step 6 : Design Future State
Based on the improvements prioritized, the map can be copied in eVSM and then modified to reflect the planned improvements in the future state.
A dashboard capability exists to show the current and future state side by side and optionally key metrics that will change and an implementation plan with a Gantt chart
Step 7 : Implement
Kaizen shapes on the map can have associated attributes (description, targets, owner, date etc..) and can be exported to an Excel spreadsheet. Excel can then be used to plan the implementation projects.
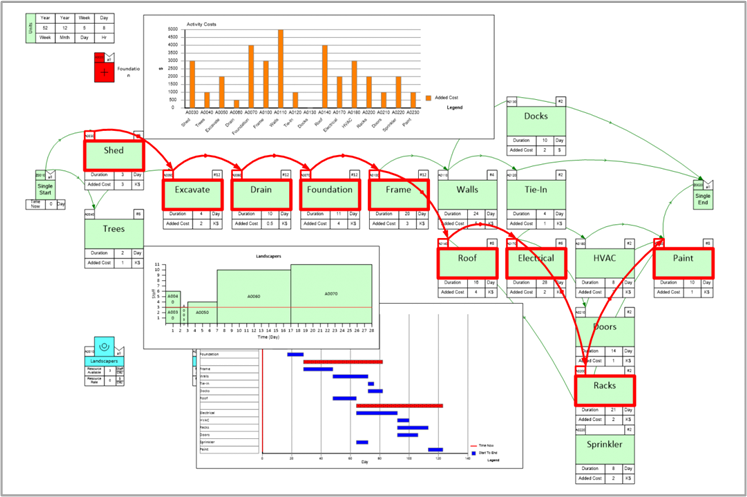
If the projects are to be broken down into tasks and have dependencies with each other for timing and shared resources, you can also use the visual project planning tool built into eVSM. It will allow you to lay out tasks and connect them to indicate the timing dependency. It will output a Gantt chart and indicate the critical path. The implementation plan can then also be included on the value stream dashboard
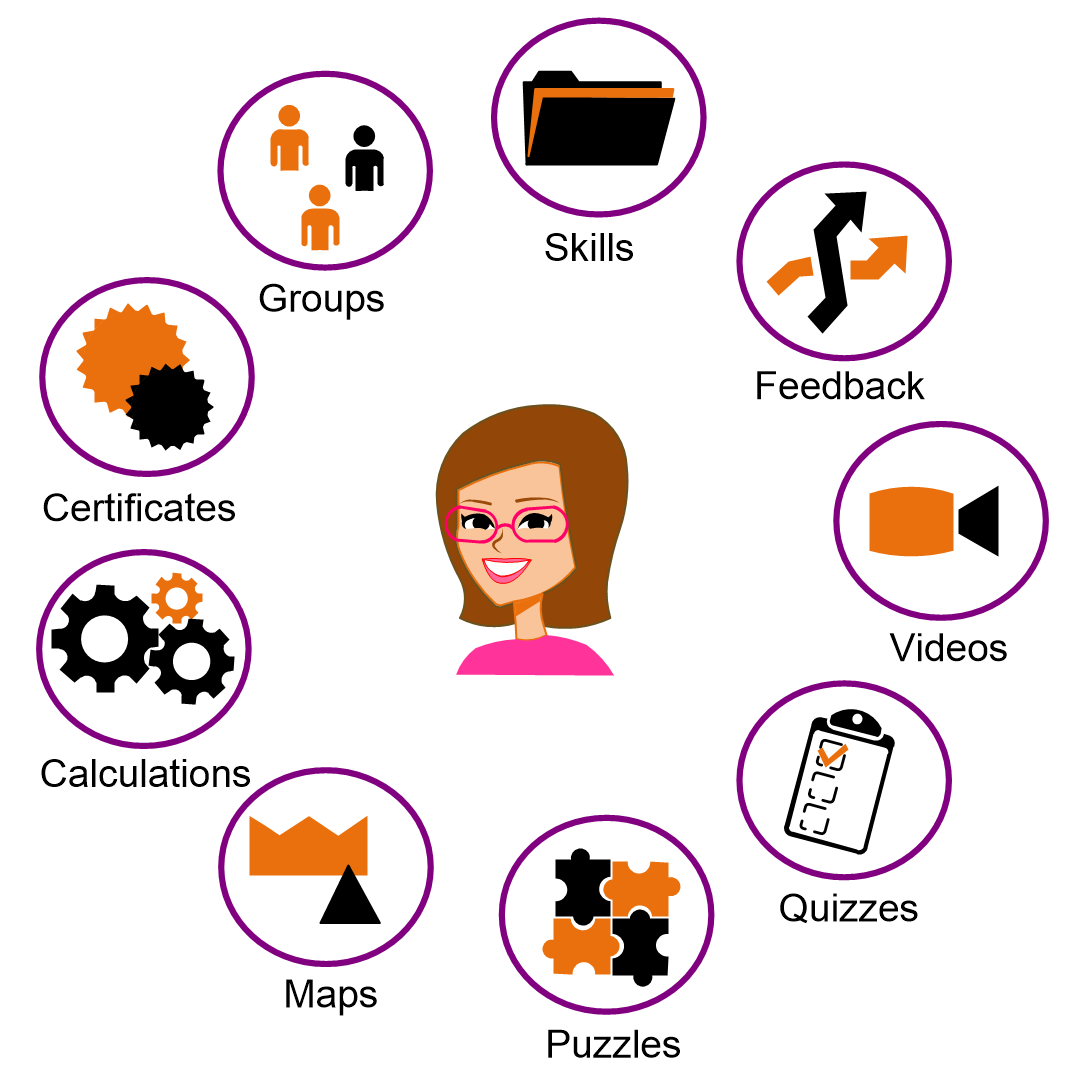
The eVSM toolbar – organized by improvement cycle

You can see that the eVSM software is fully focused on supporting the full improvement cycle for each value stream type (production, supply network, transactional). This focus extends to the eVSM toolbar also which is organized from left to right in support of the cycle with map capture at the left and improvement ideation and management on the right.
Learning to leverage eVSM for your improvements
To be able to leverage eVSM in your improvement efforts you need to learn the details of the software. Each of our mapping applications comes with its eLearning modules which help you systematically learn the software with lessons and hands-on exercises so you can learn by doing. The eLearning is included in the license fees and those who pass the courses receive formal certification that recognizes the valuable skills they have attained.