Excel is a powerhouse tool for collecting and analyzing data, which is why pretty much every company uses it. That's the reason we at eVSM have relied on Excel for so many of the lean tools we create: our users already know Excel and use it regularly (and we also require that it's installed on your PC).
So I just wanted to talk a little bit about how we've tried to make building maps faster and easier for you, taking advantage of Excel. In this part, I'll cover a simple tool for building process steps from Excel, but in subsequent posts I'll talk about how you can use process data for building maps, and how you can get eVSM map data out of Visio and into Excel.
So, say you're trying to take a post-it wall map and capture it electronically in eVSM. To do it interactively in eVSM, you'd have to drag out a process step from the appropriate eVSM stencil, then type in the process name. Then you have to drag out the next process step, and type in the name, repeating until you're done.
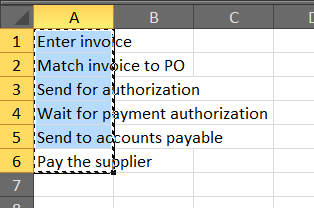
A better way to do that, would be to just fire up Excel, and type all the process steps in order down a column in a spreadsheet. Then you can just copy those cells to your clipboard:
In eVSM, pick the eVSM stencil you want to use, and drop out the time and units center from that stencil (or any shape from that stencil - you just have to tell eVSM you're using that stencil for that page).
Then, pick the master you want to have on the page (this tip only works to create a single center type - part 2 will give you control over what type of center for each row of your spreadsheet).
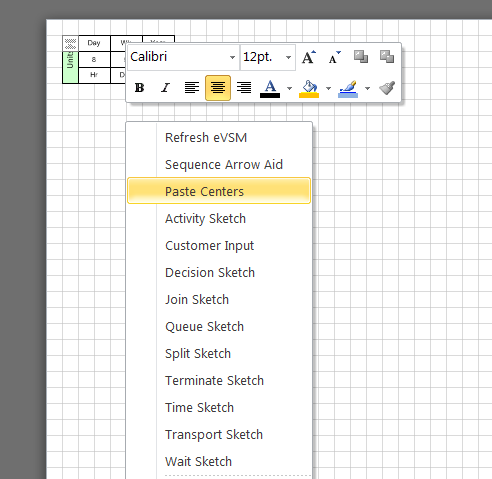
With the master picked (in this case, I picked the Activity Center in the Quick Transactional Pro stencil), right-click on an empty part of your page, and select 'Paste Centers':
eVSM will then draw a separate center for each of the cells you copied to the clipboard, with the text from that cell as the text for that center:
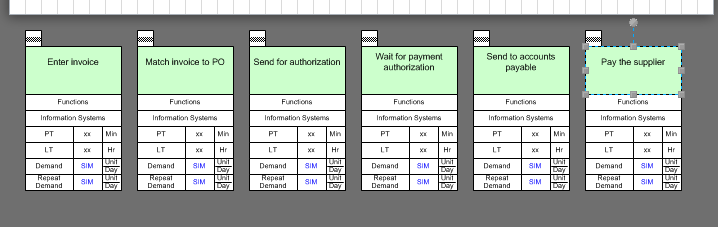
From there you just have to grab the green shapes and reposition the centers as you need them!
Check back next week for Click here for part 2, which will show how to select different center types as well as include variable data in your import..