This blog covers the collection of improvement projects from diverse sources into a single project hopper where they can be prioritized. It also shows how priority projects can then be improved in a lean fashion, starting with a value stream map. A case study is used to illustrate all these aspects.

Nancy Such brings a wealth of expertise with over 35 years of experience in Lean practices and operational excellence. We knew her first as a lean leader in a medical device manufacturer and for the last several years as the principal lean consultant at such lean solutions.

This webinar starts with consolidating improvement projects from diverse sources into a centralized 'project hopper' for better alignment to the company’s strategy, and subsequent prioritization in a numeric fashion. Selected projects are then approached in a lean fashion, using digital value stream mapping with metrics. Finally, the project results are tracked to ensure they are achieved and sustained. Finally, the loop is closed back to the project hopper with the results being reported and other projects selected for execution.

Organizations often face a challenge in managing improvement projects effectively. Project ideas are captured in multiple lists, with unclear overall prioritization, and often with a minimal strategy or value stream perspective. This lack of structure makes it difficult to understand and agree what to focus on, and how to work systematically towards improvement. Addressing this issue is critical to achieving operational success.

The solution lies in creating a structured system to manage improvement efforts. By consolidating projects into a centralized 'project hopper' and applying standardized scoring metrics tied to strategic goals, organizations can align their efforts effectively. For the priority projects, leveraging digital VSM enables systematic analysis, and visualization is support of the project goals

A simple project hopper can act as a central repository for all active and planned projects, simplifying the chaos of scattered ideas and lists. By bringing together diverse ideas from sources like Gemba walks, strategic plans, Hoshin diagrams, and individual contributions, the hopper creates a clear starting point for prioritization and strategic alignment.

Developing a robust scoring system with leadership is essential for aligning projects with organizational goals. Metrics (like Lead Time in Column 2) and their weighting (10 in row 1 the above example) should reflect strategic priorities. Using a numeric scale (Column 1) and tying that to a range of metric values ensures consistency and clarity in evaluating and ranking projects, making it easier to focus on high-impact initiatives. So, with the above cheat sheet, if a project has the potential to reduce the lead time by > 4 weeks, it is assigned a score of 9. This is multiplied by the weighting factor of 10 to give a contribution to the overall project score of 90. Working with leadership to develop the cheat sheet also promotes their understanding of the project hopper priorities downstream and support for the projects themselves.

Once metrics and weights are defined in the cheat sheet, we can collect the projects into a hopper and make it a dynamic tool for prioritization. In the example above the cap/plug cell has risen to the top. The scores in its row reflect the cheat sheet guidelines and the cumulative score is calculated as 9*10 + 3*7 + 9*5 + 3*10 = 186

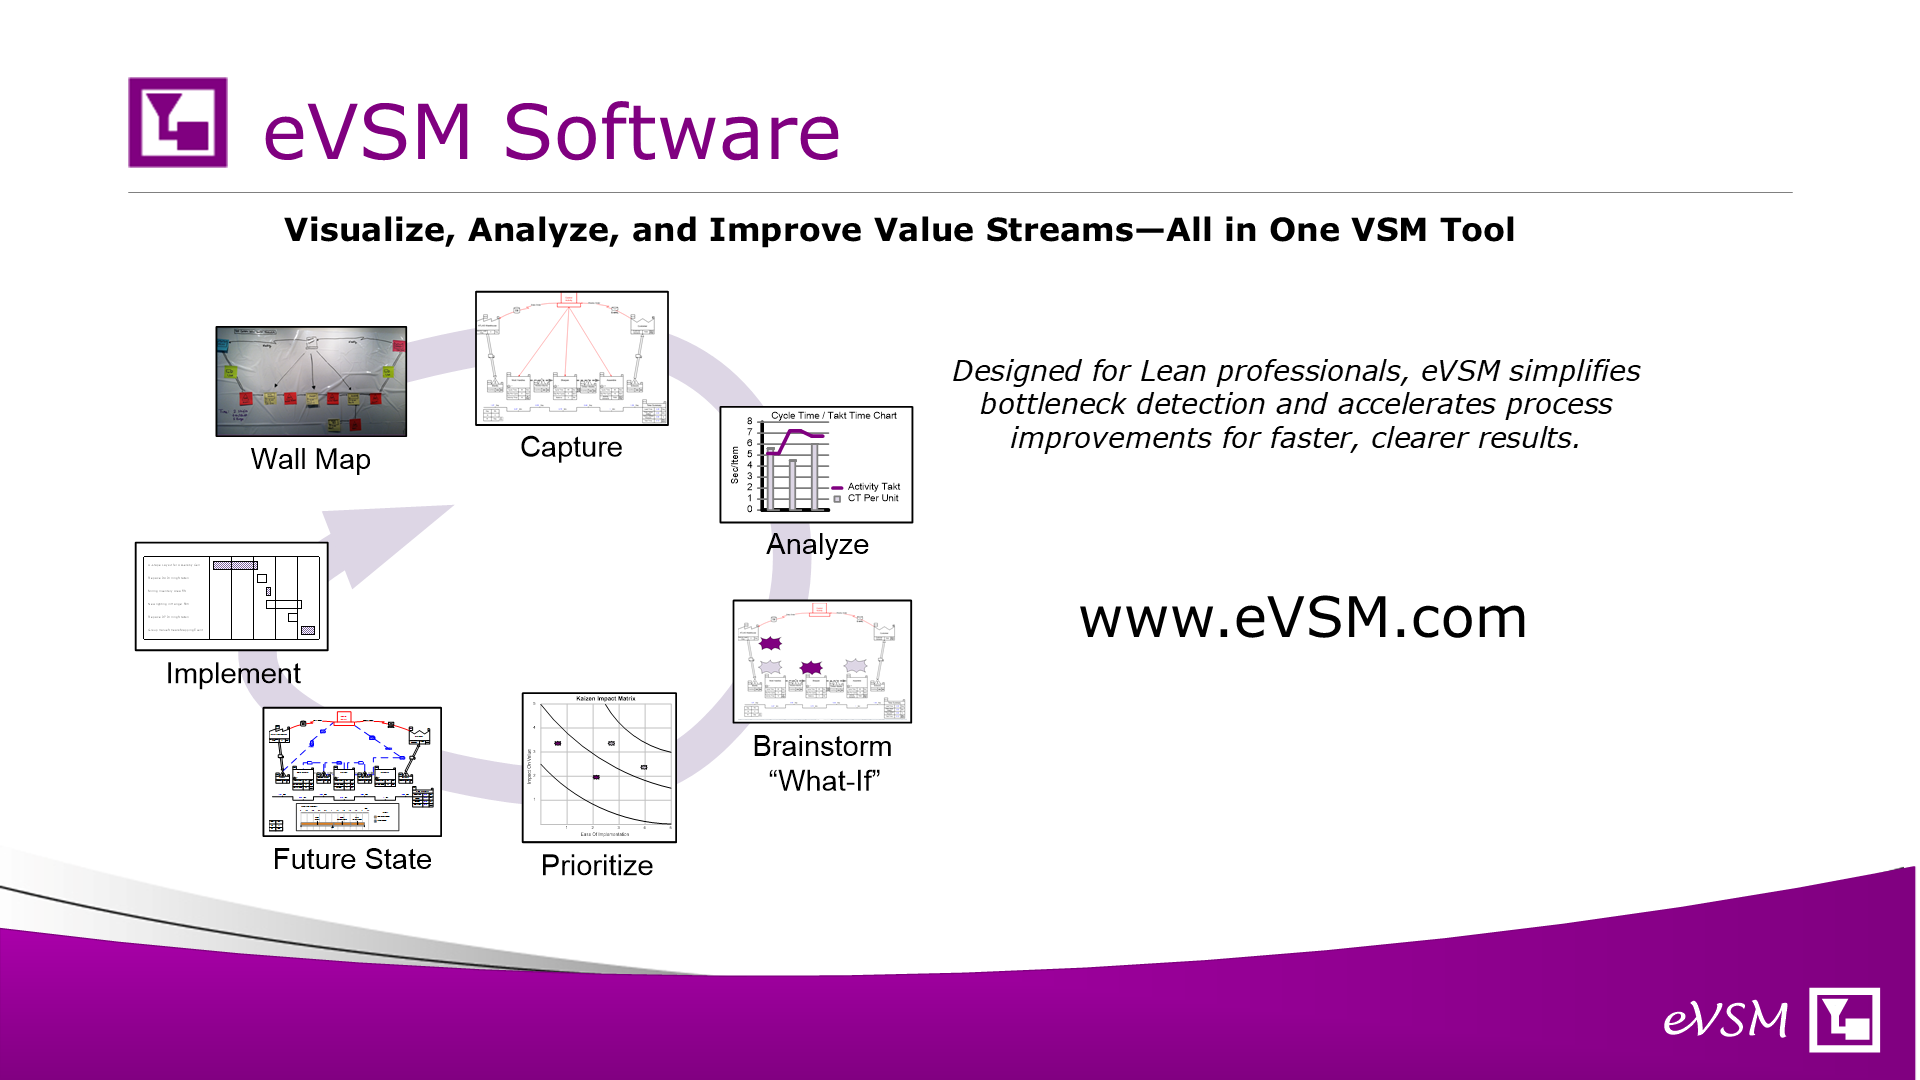
The team begins creating eVSM maps for all high-priority projects, using the digital eVSM software to map out current states, with metrics and visuals. This combined with the project goals, provides a clear canvas for Kaizen-driven problem-solving and data-driven decision-making. It reduces the risk of projects not meeting their intended targets

Using a structured project hopper and the digital eVSM software provides multiple benefits, including alignment with strategic goals, clear prioritization, and actionable insights for leadership. This approach supports data-driven decision-making, enabling organizations to achieve their objectives efficiently and effectively.

In this case study, a cheat sheet and then a project hopper has been built. This has led to a prioritized project focused on reducing lead time in the Cap and Plug Cell. These two excel spreadsheets are standalone and outside the eVSM software.

Both Cap and Plug production is done with shared resources. The project prioritization reflects current long lead times, excessive floor inventory, and missed deliveries.

It was decided to initiate the project with key steps taken over three days

Current VSM’s exist in Excel but they had significant limitations. Separate maps for the cap and plug made it challenging to understand shared resource capacity. Additionally, there were no charts for capacity, lead time, or resource balance, and conducting 'what-if' studies was nearly impossible. These shortcomings highlighted the need for a more effective digital value stream mapping solution.

Using the eVSM software, we transitioned from separate maps to a single digital mixed-model map. This transformation enabled automatic analytics and provided detailed charts that made it easier to identify and address process inefficiencies. “What-if” studies can now be easily done.

The VSM analysis showed sufficient capacity across all stations and a balanced use of resources. However, the lead time of 8.55 weeks was flagged as excessive. A closer look at the Lead Time Ladder revealed that a significant portion of this time was non-value-added (NVA) at inventory pockets, highlighting areas for immediate improvement.

In addition to excessive inventory, the map analysis and Gemba walk revealed significant additional issues. There was overproduction due to a misbelief that more is better. Scrap issues, traced back to machining, remained undetected until inspection weeks later. Leveraging eVSM tools allowed for efficient data entry and Kaizen-driven improvements to tackle these challenges systematically.

The team used eVSM’s Kaizen Impact Matrix to brainstorm and prioritize solutions for the improvement of this project. Implementing a WIP cap (a maximum limit on inventory at a location), stood out as a high-impact, low-effort solution. To address excessive inventory, the plan involved temporarily shutting down machines, which required leadership approval due to resistance from operators. Collecting all solutions in one spot, such as on the future state map, ensured clarity, joint understanding, and effective tracking for execution.

The improvements involved implementing a Cell standard work plan that tracks Cap and Plug processes and avoids over-production. This simple visual management system was effective in creating a self-scheduling cell, ensuring the team knows what needed to be completed for the week. A display cube further supports transparency and communication

Implementing a WIP cap is a straightforward but effective step to manage production flow. By removing excess storage and setting clear limits with signage, the team avoided overproduction and created a smoother workflow. In this case, caps and plugs were limited to 40 pieces each, emphasizing simplicity and clarity. This small but impactful change demonstrates how visual limits can enhance efficiency without costly system upgrades.
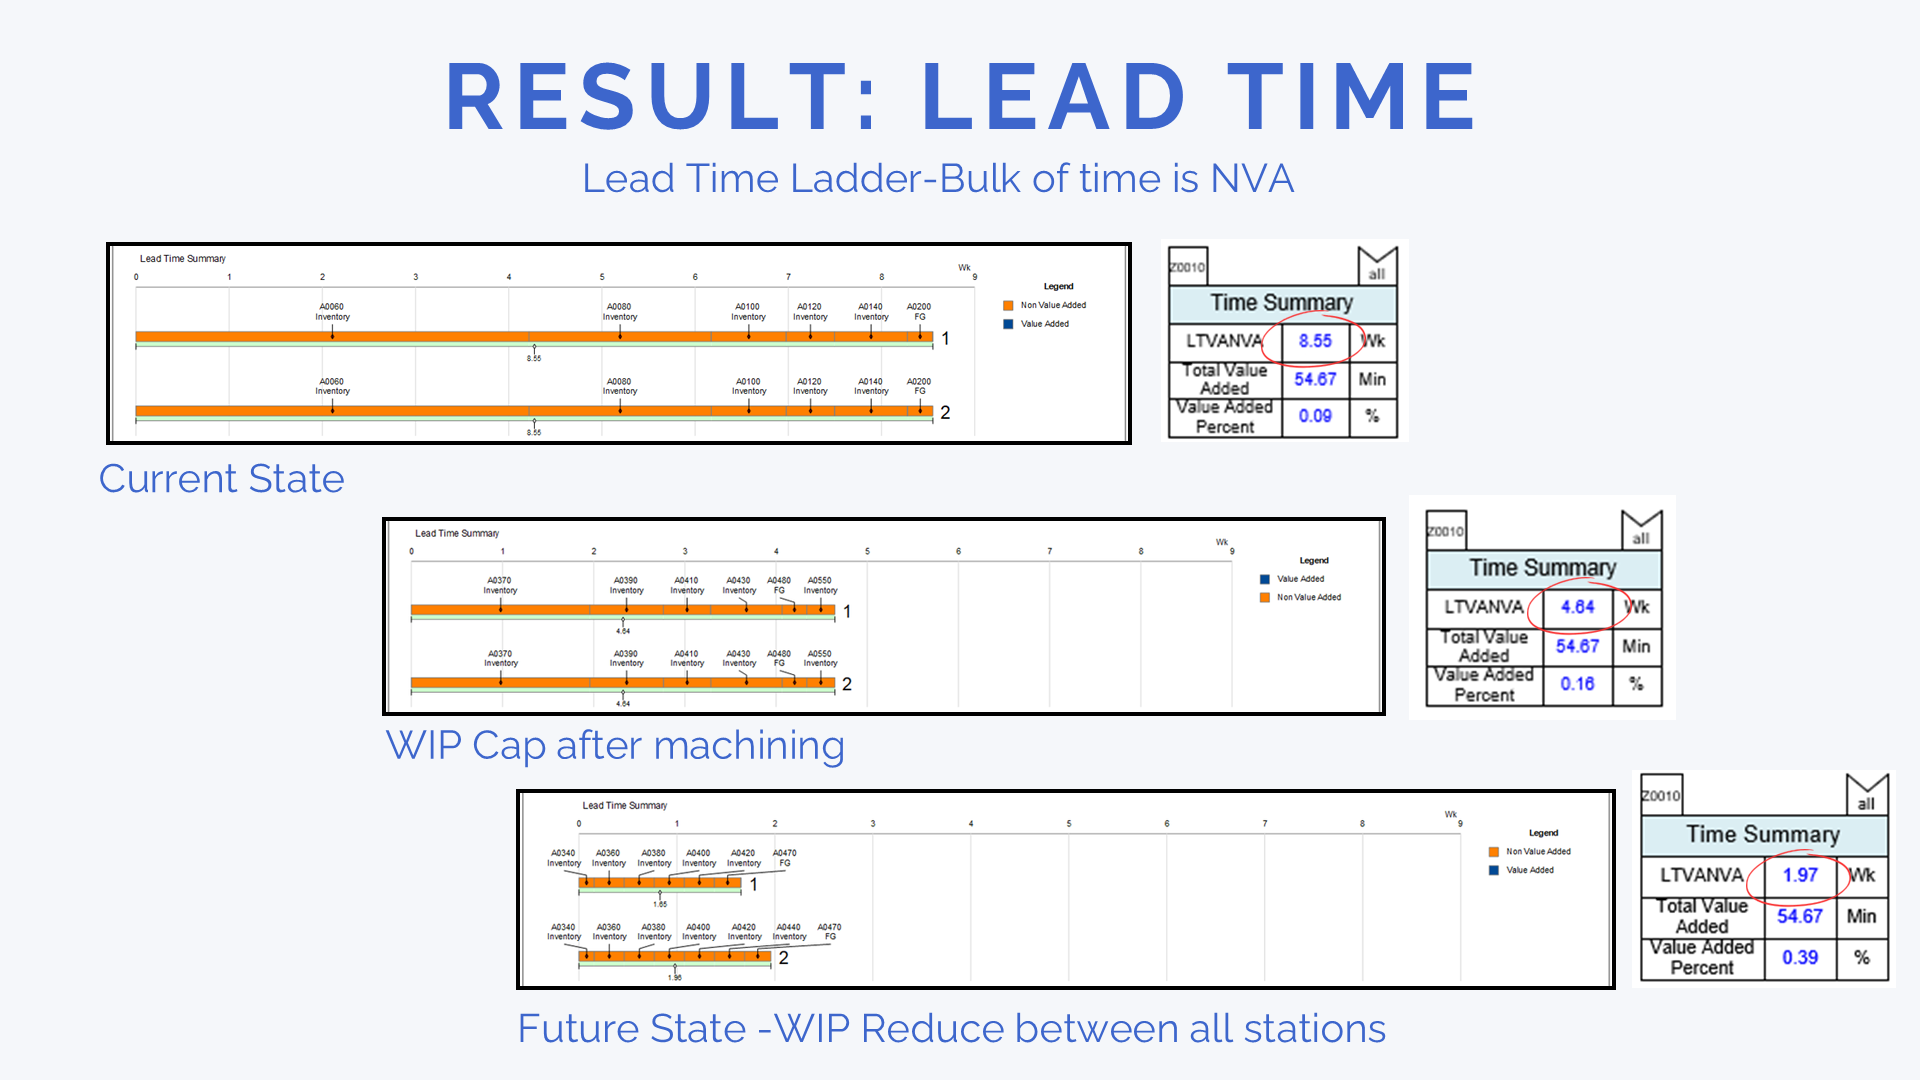
The implementation of a WIP cap and better process control led to remarkable results in reducing lead time. Initially, the lead time stood at 8.55 weeks. By limiting overproduction at machining, it was brought down to 4.64 weeks. Further reductions in WIP across all stations resulted in a future state lead time of less than 2 weeks.

Aligned operational improvements can drive powerful outcomes. In this case, lead time was reduced from 8.5 weeks to under 2 weeks, and inventory after machining dropped from 2200 pieces to just 80. Early defect detection led to a scrap rate reduction from 8% to 3%, while visual management improved OEE by 4%. These changes not only met the project’s primary lead time reduction goal but also delivered an annual cost saving of over $80,000. This demonstrates how focusing on efficiency and quality can yield financial benefits.

Tracking project metrics is crucial for measuring impact and maintaining momentum. In this case, a simple monthly tracker, updated with real-time floor data, provides visibility into cumulative savings over 12 months. This approach ensures that project outcomes remain transparent and celebrated. Keeping the tracker uncomplicated makes it an effective and manageable tool, ensuring it doesn’t become a burden to maintain while still delivering valuable insights into progress and results.

In summary, we showed the value of creating a cheat sheet by which project scores could be allocated. We collected projects from diverse sources into a centralized project hopper and then scored them based on the cheat sheet. Finally, we pursued a prioritized project in a lean fashion using digital value stream maps.
The priority project case study highlights how a structured approach to process improvements can yield remarkable results. By transitioning Excel maps to eVSM, the team tackled inefficiencies like high WIP and inspection scrap rates. Key actions, such as implementing a WIP cap and introducing standard work, led to transformative outcomes: lead time reduced by 6.6 weeks, scrap rates cut by 5%, and OEE improved by 4%. This project demonstrates the value of leveraging digital tools and Lean strategies to enhance operational efficiency and quality.

As a bonus, you may not know that eVSM has explicit activity-based costing capability. Let’s see how it works
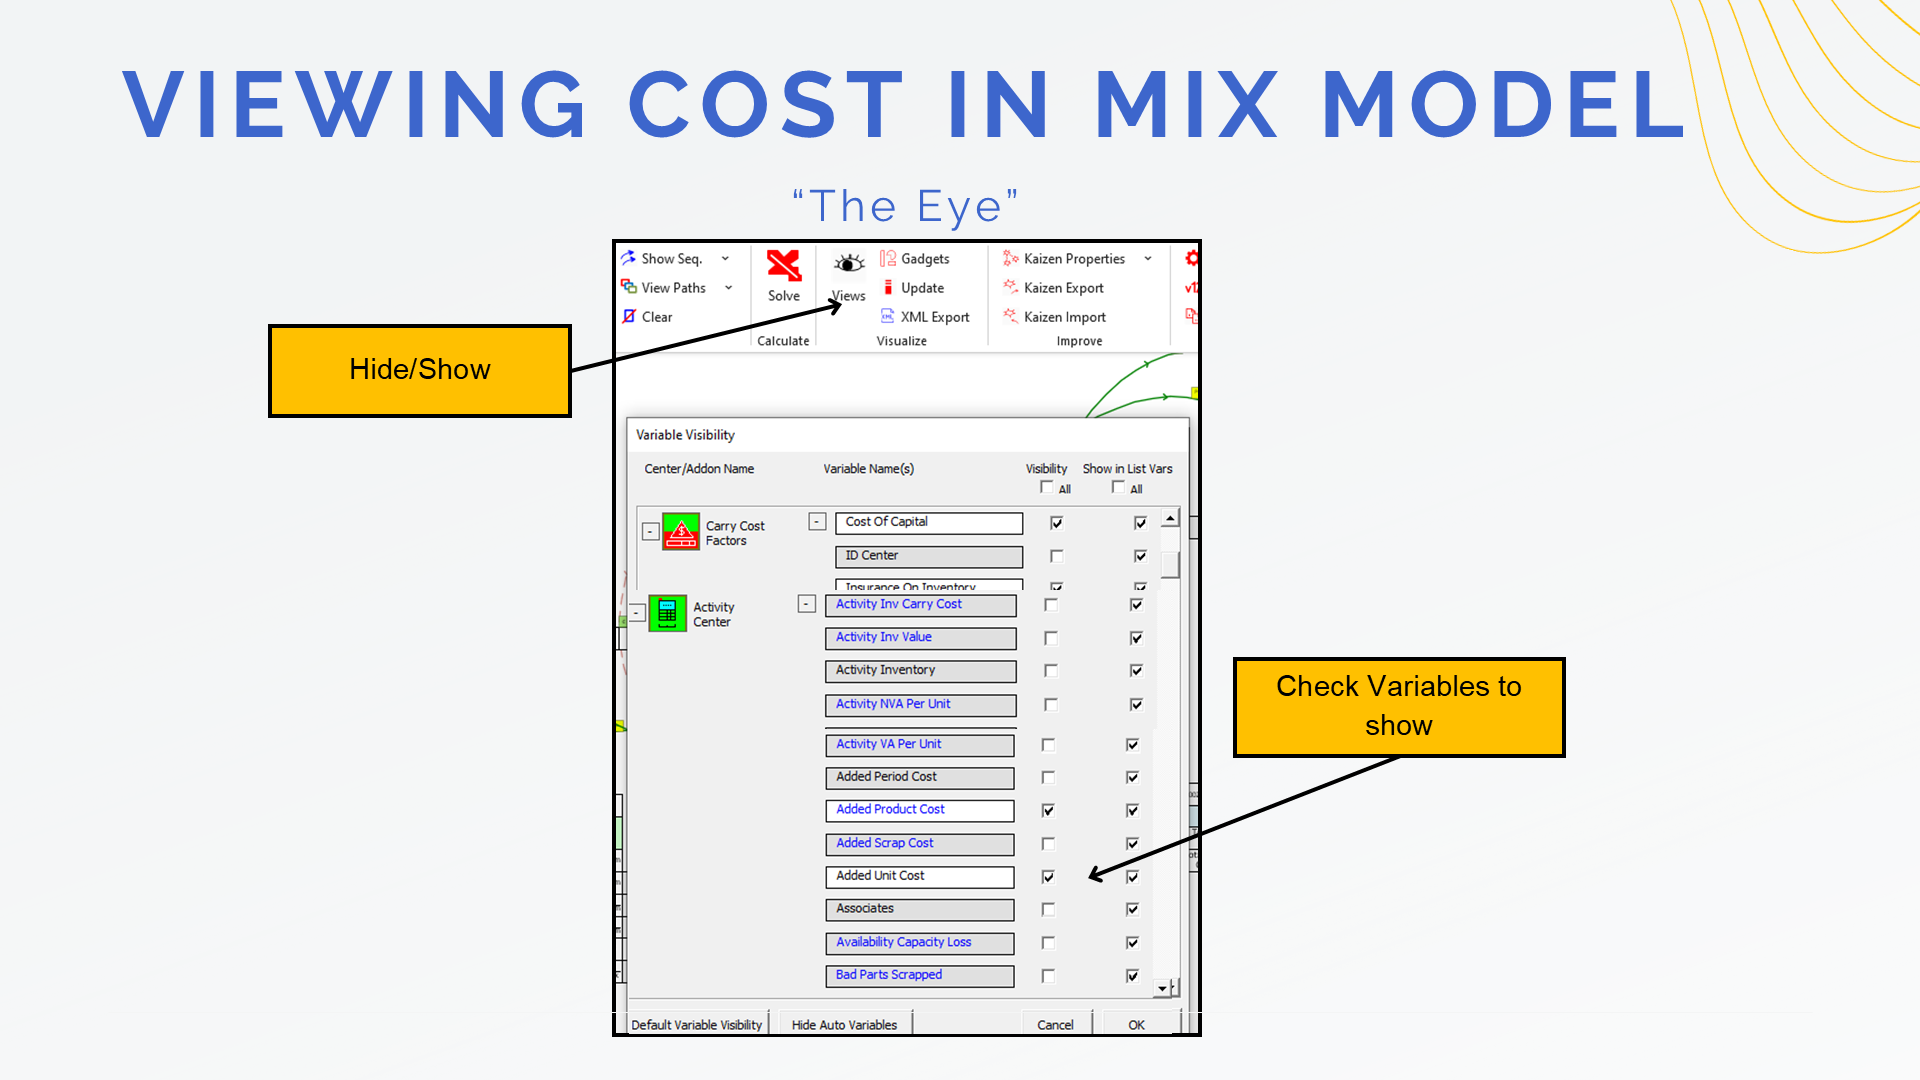
eVSM provides an intuitive way to view cost variables within the mix model. The ‘eye/views' tool in the toolbar allows users to toggle visibility for specific variables, such as 'added product cost' and 'added unit cost.' This feature ensures that critical cost-related data is accessible directly on the map, making it easier to analyze and optimize processes. The flexibility of this tool enhances visibility and supports data-driven decision-making without overloading the interface.

In the map, we entered fully burdened resource rates, including labor and variable overhead, and added unit costs at applicable activity centers. The machining step showed where costs were incurred for materials. The cumulative unit cost was calculated at the last sequenced activity center, providing visibility into total production costs. Determining if $19 or $20 is acceptable depends on the target profit margin and should involve collaboration with the finance team

Our services at Such Lean Solutions are designed to help organizations achieve operational excellence and cost savings. From aligning initiatives using the Project Hopper/Hoshin Matrix to facilitating Kaizen workshops, we offer a range of solutions to drive continuous improvement. We specialize in leading value stream mapping events with eVSM for rapid analysis and implementing performance metrics for hourly, daily, and weekly tracking. Whether optimizing process flow or digitizing value stream maps for real-time collaboration, our offerings cater to diverse industries. Services are tailored to your needs, and delivered onsite or remotely, ensuring impactful results. Documents from the case study are also accessible for reference.