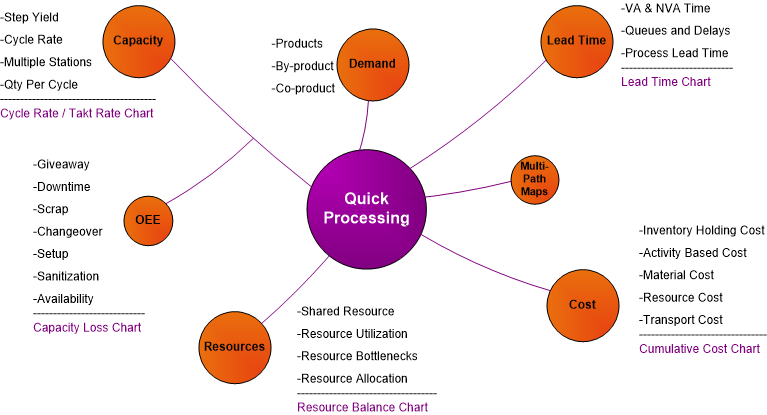
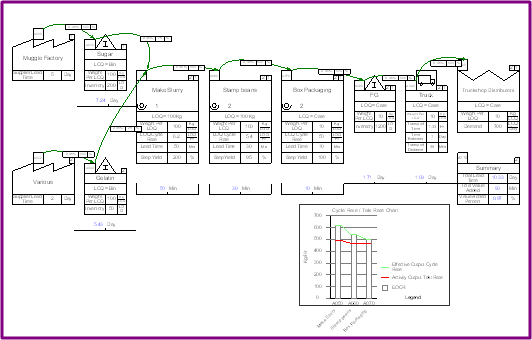
Quick Processing is one of eVSM’s Quick Stencils and supports plant level mapping of chemicals or food processing.
Ex 1: Increasing Capacity
To meet an increase in demand from 700 to 850 Cases a day, we can increase the Cycle Rate of Box Packaging to 600 kg/Hr with a small capital investment in the machinery. Will we be able to meet the new demand?
Ex 2: Relieving Bottlenecks
Can we relieve the bottleneck at Stamp Beans if we can run the station an extra 4 hours per day?
Ex 3: Setup Time
At the beginning of each production day, each process step undergoes a certain amount of Setup Time (consisting of cleaning, sanitization, preventive maintenance, etc.). The setup times are as follows: Make Slurry = 1 hour, Stamp Beans = 30 min., Box Packaging = 30 min. How does this affect Capacity?
Ex 4: Scrap and Giveaway
Stamp Beans has a Scrap Rate of 10% and Box Packaging has a Giveaway Rate of 3%. Is the process still capable of meeting demand? How much additional Slurry will be needed per day?