| Welcome to Secrets to Success in Transformation, sponsored by eVSM and partnering with John Gaul - Lean Six Sigma Master Black Belt President of Sum It Ascent LLC. | ||
| ||
 | ||
| I worked in manufacturing for about 20 years in Process and Quality engineering. Then, for 15 years I worked with one of the largest Lean Six Sigma training & consulting providers in the world. I worked across many industries and trained well over 2,000 LSS practitioners in the classroom. I also provided coaching of students and onsite mentorship. I now have my own company: Sum It Ascent LLC. Suddenly, I have over 40 years of experience out there doing Lean Six Sigma training, projects & guidance within the methodology - I just can t stop doing it! It s very rewarding, and I m always learning and meeting great people! | ||
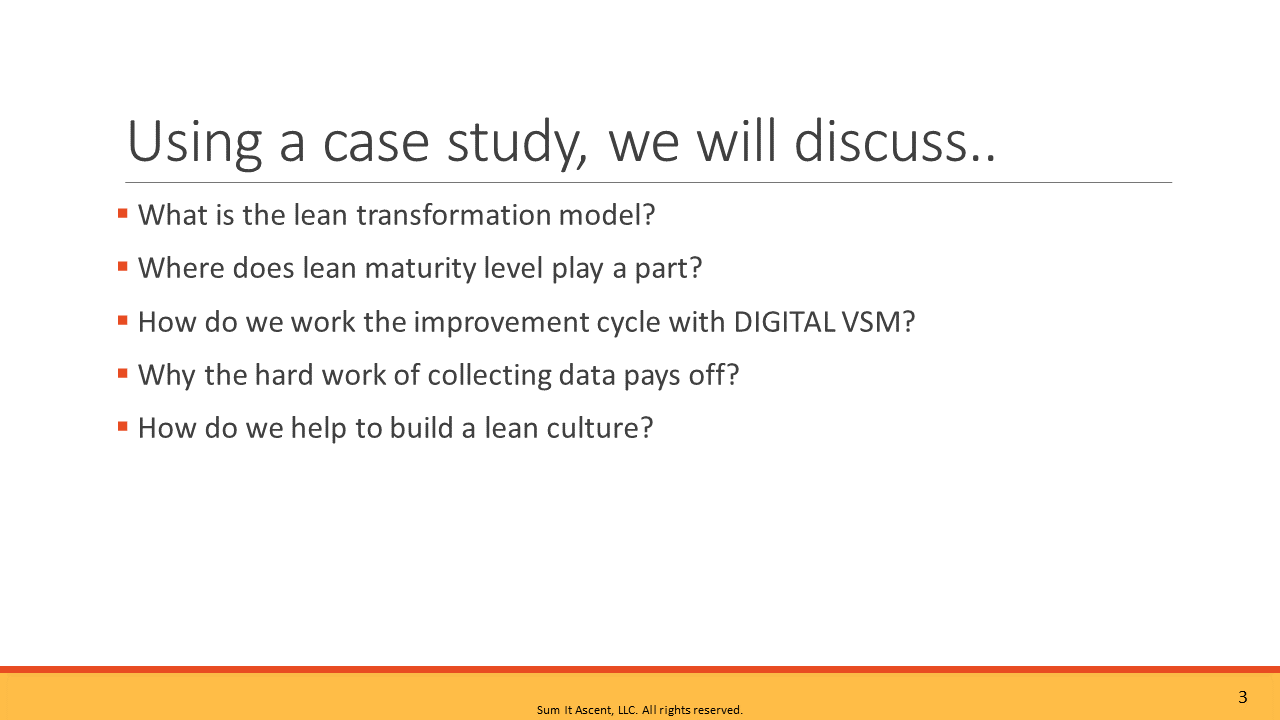 | ||
| As we work through our case study, these are some of the takeaways that you ll appreciate. We re going to look at a Lean Transformation Model that you may be familiar with and, we re going to look at the improvement cycle framework that eVSM offers. We re going to talk a little bit about Lean maturity level and how that plays into conducting improvements & transformation in your organization. And of course, we re going to demonstrate how to apply digital tools to do the work. We will demonstrate how the hard work of collecting & analyzing the data really pays off. Finally, along the way, we provide some tips and thoughts about building your Lean culture! | ||
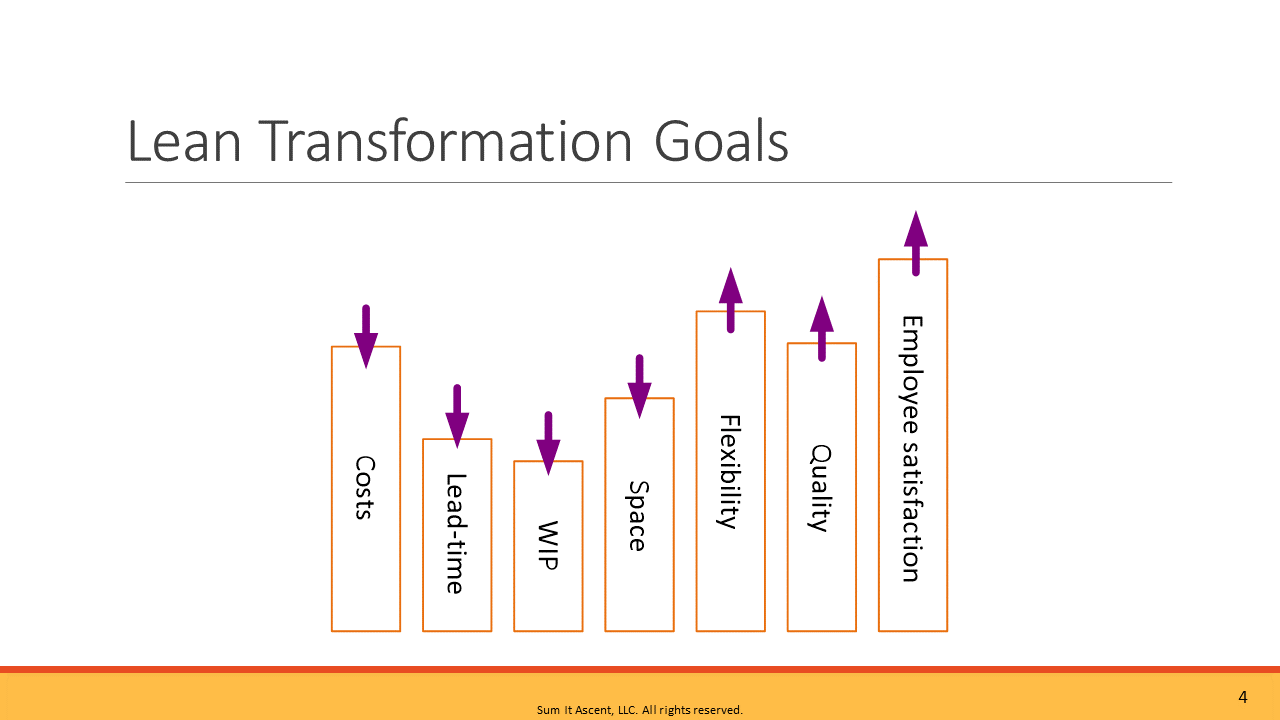 | ||
| We all know the great benefits we can get from Lean Transformation, whether it s plant wide, company wide, site wide, across a value stream, or right in a cell itself. Lower cost, lower lead time, and so on. You ll see these benefits demonstrated today in our case study. Those of us who do this work consistently see benefits as these, sometimes to astonishing levels! I m no longer surprised at how big the benefits can be. | ||
 | ||
| Let s introduce you to a Lean Transformation Model. This one comes from John Shook who is the greatly respected CEO and Chairman of the Lean Enterprise Institute. John has a great YouTube video that you might want to check out. The link is here on the slide. It s about eight minutes or so and he does a fine job. Of course, he uses a schematic diagram and eloquently takes us through it. At the end, he boils it down to five key transformational questions, which are: What problem are we trying to solve? How are we going to change the way that we do the value-creating work or improve it? How will we develop the people to operate successfully in that value creating work area? And importantly, what leadership behaviors and management system is required to support them in their success? Finally, thoughts about the current level of Lean maturity, or the culture, the mindset of the organization where you re doing the work. I view this model as a bit more strategic than tactical, but it can be applied tactically. | ||
 | ||
| Speaking of Lean Maturity, this is how I see it. This didn t come out of a book anywhere. This basically came out of my empirical experience and observations. As we scale the pyramid, starting at the bottom, building a foundation, and then working your way up to the summit of becoming a Lean Enterprise. In a Lean Enterprise, you re operating in a Lean fashion throughout your operations, including all your supporting functions. And you re also working with your customers and suppliers, helping them, working with them, all to empower your Lean operation and your value streams. You can work your way up from the basics: basic process management metrics that tell you how the process is running, starting to identify and eliminate waste, a little bit of 5S, starting to get some visual organization and decluttering your work areas. The primary analytical tool in the foundational level is mapping (visualize the creation of value). We then work our way up through creating flow, more 5S, visual management, standard work and so on. When you become more advanced, you can start thinking about broader application of pull systems for bringing materials into your product lines, and inventory reduction, which will improve your on-time delivery and customer responsiveness. Consider where you are on that continuum right now. It does affect how we might start or how we might approach Lean Transformation of a given area, but it doesn t stop us, no matter what level, and we re going to demonstrate that today in the case study. | ||
 | ||
| This is what we do! This is the eVSM Digital VSM / Improvement Cycle framework. This is what I follow as I help my clients with transformation. We always start with a wall map, then capture current state electronically and get all our data in there as well. Then we analyze the current state and visualize the data, and that is a very insightful activity. While doing all this, we re not just in a room somewhere! We re out in the Gemba, out on the floor, observing, gathering data, talking to operators, asking questions, answering questions and so on. All the time, we are looking for and capturing opportunities. Analysis and observation unfold into opportunities and project concepts. We also apply what I call Lean Design Principles which are prevalent in the great Lean literature we have all learned from. LEI (Lean Enterprise Institute) has a wonderful library of guides for us. This all boils down to some projects that we re going to do to make the transformation from current to future state. We should prioritize the projects, typically kaizens and could also be Just Do Its. You may require the Six Sigma methodology for getting to the root cause of chronic performance problems, out of control processes or unwanted variation. You may also generate minor capital projects: Perhaps you need to buy and install a new piece of equipment or backup parts for preventive maintenance, or enhanced equipment for presenting units and parts to the operators. With the digital tool set available, we can easily design a future state and conduct what-if scenarios to demonstrate, or model, what the performance will look like once we implement our improvements. Then, implement! (Hint: We have likely been implementing small improvements and waste eliminations along the way!) | ||
 | ||
| Next, a case study of a client that I worked with recently - a custom printed circuit board manufacturing house. We worked on their core value stream. | ||
 | ||
| A quick background on PCB production. This is very simplistic view, but it starts out with a substrate board. Then typically drilling or punching of that board to create through-holes so the circuits can pass to both sides of the board. Masking may be done, laying down solder patterns, laying down connecting points, usually done with automation. Simultaneously, components are added, and much of that today is done with automation using Surface Mount Technology. However, there are many cases where the components must be added manually, because it s just too tedious or just can t be done easily with automation. That s the case in our study here - about 80-90% of the components are placed via automation. The remainder require very tedious work, putting very small components on the board with microscopic optical tools and soldering devices. There are testing, cleaning and coating cycles that take place mid-process and at the final completion of the board. | ||
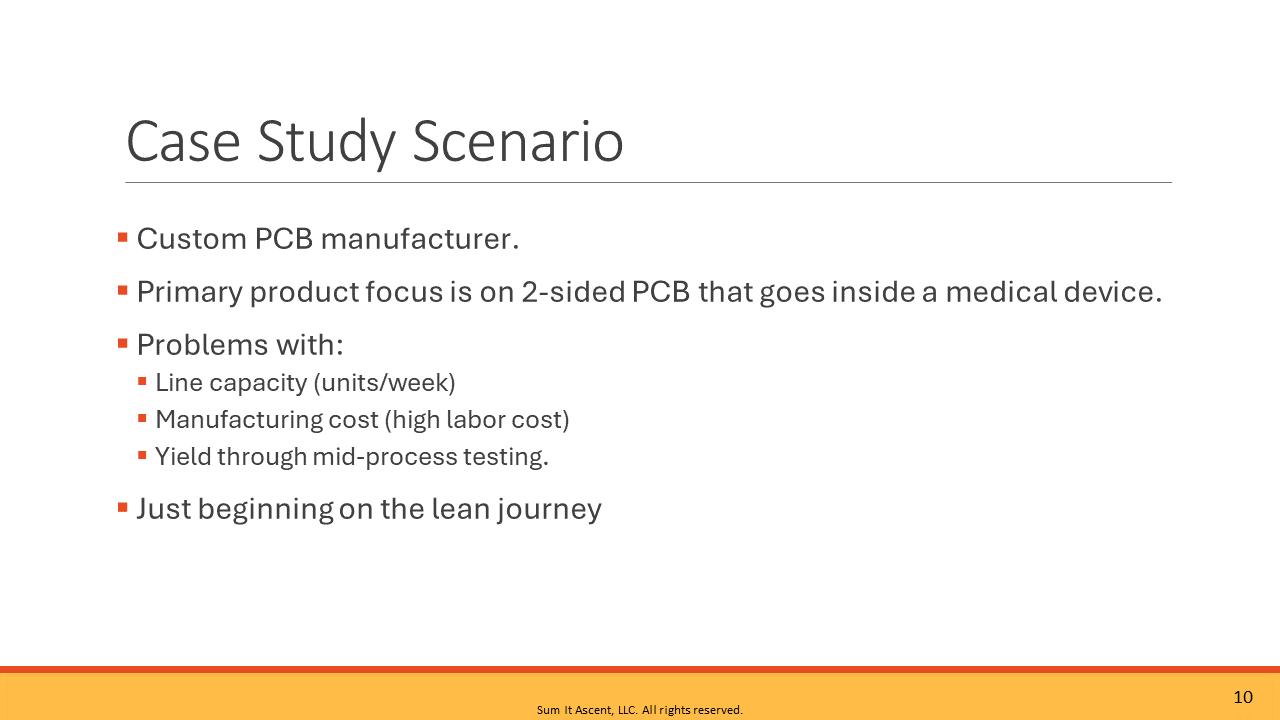 | ||
| The scenario for this case study is a custom printed circuit board electronics manufacturer. This product is a very small 2-sided board that ultimately is folded over and goes inside a hearing aid. There were three core problems in the value stream that we wanted to address. Line capacity: they just weren t meeting customer demand on a consistent basis. Some weeks they did great, some weeks not so great. We identified, not initially, but along the way, that the manufacturing cost was much higher than it needed to be. There was also a yield problem in a mid-process testing point, and that became a sidebar project that required the Six Sigma toolset, which I led in addition to this Lean effort. We won t be discussing that piece of it today. The maturity level of this company was quite low - they essentially had no Lean presence. They did have some good practices in place that Lean companies would do, and they were purposeful in those. They did have some staff that were trained in Lean in the past at prior employers. And I was fortunate, because the leader of the cell, who was a wonderful lady to work with, was a trained Six Sigma Green Belt, and had been Lean-trained and done some Lean work in former positions. So, she knew what could be done. But to take that on herself seemed like a steep mountain! Can you still achieve great benefits with zero Lean maturity and a bit of guidance from an expert? Let s find out | ||
 | ||
| We started with the Current State Wall Map, as we always do. We like to draw these on the wall. It may seem old fashioned . You might think, Why don t you pull out your eVSM and go to town up on the screen? Well, there s something magical about a group of people standing in front of a giant sheet of paper with sticky notes for two or three days, or however long it takes, and really hammering out the details of how the process works, how things flow, how things connect, who s doing what, flows of information, etc. Notice the blue cloud sticky-notes which signify opportunities for elimination of waste and enhancement of flow. While mapping, we went back and forth out to the floor, observing and talking to the operators and so on. We always start these sessions with a deep tour of the value stream, observations, questions, and conversation with the staff. Gemba is the place where the work is done . | ||
 | ||
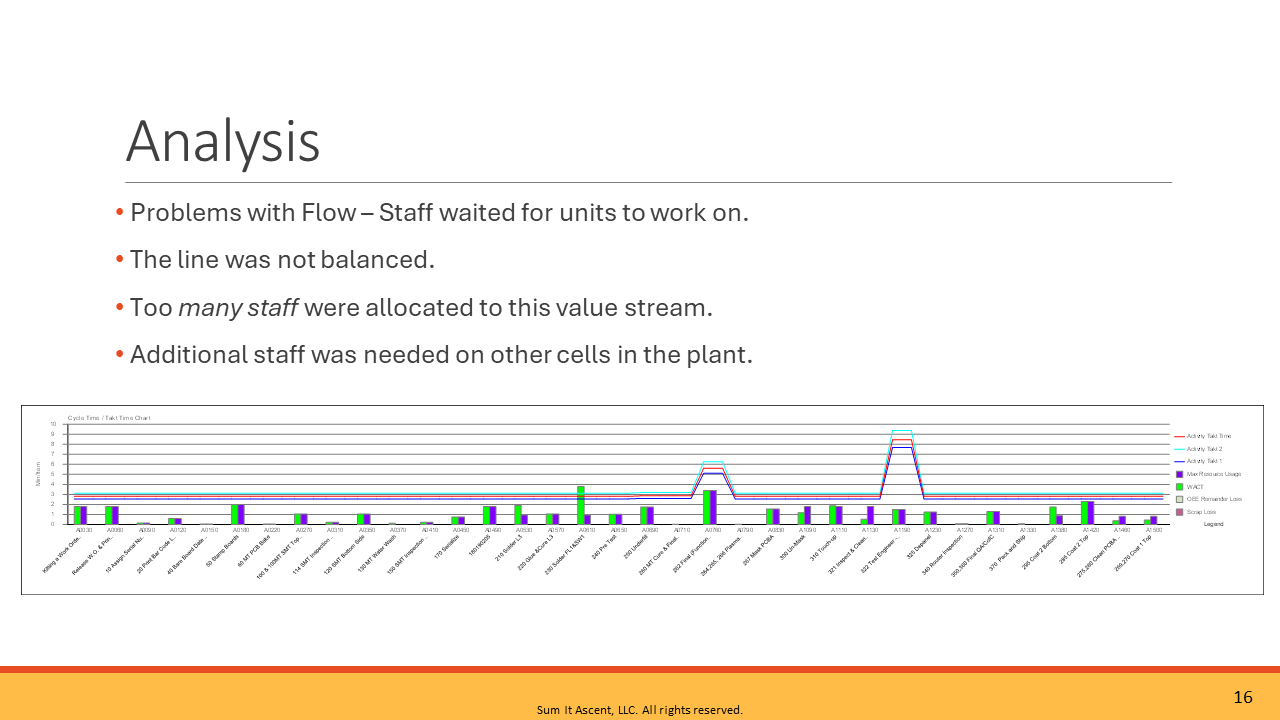
| What did we see when we were out there on the floor? Depending on how mature your Lean eyes are, you would immediately see some things, and we saw that their flow was essentially broken, and their parts were zigzagging all around from one station to another. At one process step, units were traveling all the way across the plant to a piece of equipment, and back again. We ultimately were able to move that equipment over into the cell, We saw the opportunity for some visual management that would help. It is common to find waste, and we were able to tidy up and get rid of a few small wastes. Ultimately, the most substantial opportunity that manifested was staff loading, and balancing the workload among the skilled operators that were working in this value stream. | ||
 | ||
| Once you get the wall map done, eVSM has Sketch stencils with which you can quickly draw the map in a simplistic format. You can simply drag out the icons, replicate your wall map very quickly, build out the flow, build out the routes, and so on. You can get the structure/backbone built before you start bringing in all the data. This is a wonderful way to begin the electronic map. From the sketch stencils, you can quickly and automatically add the data cells and start entering data. | ||
 | ||
| Notice the main value stream in the middle of the page. At the top, we have zoomed in to a piece of the map to demonstrate the look and feel of an eVSM map with data. Where did we get this data? It s a lot of work, but it s worth it. It takes dedicated time to gather all the data and make sure it is accurate and makes sense. We did a detailed time study. If you want to make someone nervous, grab a clipboard and a stopwatch and go stand there and watch them work! It can be a frightening event for operators. TIPS: Remain casual, introduce yourself, speak with the operators with great respect, tell them what you re doing. Tell them that you re focusing on the process, not on them. We ask them to just stay calm and work at their normal pace, and we re just going to stay out of their way and not interrupt - and gather the data. However, inevitably, they do get a bit nervous, and they tend to work faster than they normally would, because they re being watched. We acknowledge this, and we know we must take that into consideration later during analysis. At the bottom, you will notice on the Cycle Time / Takt Time chart that there is a lot of white space between the takt time line and the green bars, in many instances. This tells us there s lots of available capacity here that we re under-utilizing. | ||
 | ||
| Next, we focused on the staffing. It happens that, right in the midst of this project, just before we did the time study, the CEO flew in from another continent to visit the plant. He spent quite a bit of time with us, because he wanted to see what we were doing on this important value stream; how we were progressing on getting the demand settled. At one point, he said I think, there is too much labor cost in this job, and we could be making more money . The product was profitable at the time, but it appeared that higher profitability was a potential if we straightened out the application and balancing of the labor force. The CEO had a sense about that and was happy to find out later that he was correct! Notice where we zoomed in on the map to show how resources can be allocated to the various process steps with as much detail as needed. The Resource Balance Chart can be subsequently generated. The chart shown here also demonstrates lots of white space between the Resource Time Available line and the Sum of Resource Process Time bars. In other words, there s plenty of idle or available time here. That is: there s plenty of time for operators to get the work done to the demand level that we needed based on their available time per day. So, we did indeed need to re-allocate the staff. Staffing is a sensitive issue. Wisdom tells us to never lay-off or remove anyone from the business because of Lean work or you re going to kill your Lean implementation. No one in this value stream got laid off or let go! There were other ongoing projects within the company, since they are a growing & thriving operation with a solid reputation in the industry. They needed skilled workers, and they were in an aggressive hiring practice. Thus, the company was very happy to have some people freed up and move them into other cells. This afforded the opportunity for a change of pace and in some cases, new exciting work on new jobs that demanded their skill set. It s a sensitive issue, but sometimes it s the reality of what happens. I wish to note that the math to create a chart like this is very complex, and eVSM has done all the heavy lifting! I ve worked with many companies over the years, with many great Lean practitioners, and I very rarely encounter practitioners who have the skill and time to do this kind of math and charting on a regular basis. You would have a conundrum of spreadsheets! This is the beauty of the eVSM toolset, and it has become an integral part of my practice. | ||
 | ||
| A focal point of the improvement became balancing and allocating the appropriate number of skilled operators. The main problem was not with the operators and their pace it was the ability to keep enough work in front of the operators on a sustained basis. There was plenty of opportunity to balance the work among the remaining operators as we began considering reducing headcount. We also needed to ensure an adequate number of units to work on for each shift. | ||
 | ||
| With our observations, our time in the Gemba, our mapping, and the ensuing analysis, these are the projects that we teed up : some Kaizens, some Just Do Its, and a Six Sigma project. We always want to prioritize these. This is the Kaizen Impact Matrix generated in eVSM. My guidance with the client focused on the Kaizens. Notice the top two green Kaizens were very high impact, and the effort required to do those was moderate. So, this was an exciting prioritization to look at, and we proceeded immediately. I helped to facilitate the Kaizen work. | ||
 | ||
| We re-organized the cell, got the flow streamlined, moved that piece of equipment, implemented some visual management. Through application of the data, we were quickly able to determine how we could reduce staffing and still meet demand. | ||
 | ||
| We addressed the flow and ultimately cut the travel distance of every unit in half, a very common thing that happens when we do Spaghetti Diagram work! We began this case study with an introduction to a framework and a model for transformation. Structure is great, yet flexibility and creativity must be applied while you re working inside a framework. Every action is NOT going to be laid out for you in a book or in an app. As an example, I realized that we needed to get better coordination between the upstream automation SMT department and the downstream manual cell. This upstream SMT shared service runs at a high-volume, rapid, robotic pace. Thus, they run large batches of these parts (with long changeovers) and get them ready for the manual cell. In a classic sense, the upstream shared service department and the manual slower-paced cell were quite out-of-sync as far as pace. The work of each department was directed according to their scheduling system (sound familiar?). The result was: sometimes the parts were available ahead of the cell in adequate quantities, and sometimes they were not. It was occasionally described as the wild west out there! I saw an opportunity to bring the departments together in coordination and understanding. The data helped tell the compelling story. The departments agreed, This is our most important product. It s our highest volume value stream. It s profitable already. It has growth potential. There is much more opportunity here. Why are we not giving it a top priority?! The consideration was, Well, we work by the schedule and set-up times are long in the SMT area and so on. We talked through all that, but what we really needed was an agreement and a commitment from the SMT department leadership, and Scheduling, to the manual operations cell, that they would provide the parts every week, on-time, into the Kanban supermarket that we set up. We literally did a handshake on that and agreed, We re going to do this. It was a commitment that just needed to happen. We set up the supermarket at the front end of the cell so that we could flow those parts in a relatively single-piece fashion, although they were traveling on trays of 20. Ultimately, we were able to bring the value stream staffing total down from 32 people to 21. We conducted what-if scenarios in eVSM. We identified the need for a skills assessment. What skills did we need? What skills did we have? We built a Skills Matrix. The CEO had challenged us with a 2-year staffing reduction plan to get from 32 to 24 staff. We were able to reduce the staffing to 21 people within three weeks! We implemented Visual Production boards at the workstations. And we adopted a practice called P.A.C.E. (see next slide). | ||
 | ||
| We saw the need for a good framework for handling the skills needed, staffing reallocations, balancing, and ABSENTEEISM. I will admit, I was stumped - I wasn t familiar with one! So, what do you do? I am at least smart enough to know when I need to call somebody who does know (flexibility, creativity)! And so, I called a fantastic Lean Six Sigma Black Belt student that I ve known for over 12 years. He is currently in an engineering leadership role in the electronics industry. He s a great Lean guy. I ve seen some of the things he has done. So, I called Jon, and told him what we were doing, gave him the high-level. He said it sounded great! I asked, What else would you do? What s missing here? We need some structure. Jon replied, Have you ever heard of P.A.C.E.? P.A.C.E. became instrumental in structuring how we allocated the resources. The acronym stands for Primary, Alternate, Contingency and Emergency staff. At one point in the project, the cell manager said to me: You know, John, if they would give me all the parts I need at the beginning of the week, and all the people showed up every day, and we had this thing flowing like we do now, there s no problem meeting customer demand with good quality. No problem at all! Then she added: But every day I come in, two or three people don t show up . Absenteeism is part of human nature, and we need a mechanism to deal with it. She concluded with I m always scrambling in the morning. And some days we just operate with less people than we re supposed to have. Seeing an opportunity here, we got leadership involved. To summarize the discussion: This is your most important product, your core value stream for your plant. Why don t they get priority of the people every morning? Leadership saw the potential (because they had seen the data and analyses). We implemented a new policy: Each day, this value stream got the people that they needed first choice, and the rest of the cells had second choice, and we applied P.A.C.E. to the skills matrix and identified the levels of people that we needed. This provided the structure we needed. | ||
 | ||
| Here are the highlights of the benefits of this rewarding value stream transformation. A great takeaway was that my client really learned a lot about Lean, and they saw the potential of it! They now had a model in their plant, so that everyone could see what Lean can do, and they became excited. I think it ignited a passion for improvement there. They re on a Lean journey now, and I still work with them. | ||
 | ||
| Echoing back to Shook s model. How did we do at answering his five Lean Transformation questions? I think we did well. What problem we were trying to solve? We needed to meet demand, reduce labor costs, implement a Lean Model. How do we improve or change the value-creating work? We eliminated waste, created flow, balanced the work, and implemented daily visual management. How do we develop the people so that they could be successful or support them? With the skills matrix, skills assessment, listening to their concerns and treating them with respect, the day-by-hour boards, and so on. Concerning question number four, leadership behaviors and so on: Daily visual management, we enhance that a bit. They already had some things in place, but those critical agreements that were made were crucial, and adherence to those was crucial: keeping the handshake agreement! The application of P.A.C.E., and so on. And then finally, back to the mindset, the culture, the context of this company: Here you ve seen a case study in which, with a little bit of outside help from myself, they were able, with no Lean experience, to have a huge success and learn a lot. This lit the fire for their Lean transformation in their company. | ||
 | ||
| This improvement framework really works! This is what we do! | ||
 | ||
| Here are some of my secrets to success in improving value streams, working alongside my maturity model. Can you leverage great benefits from the platform wherever you are on the pyramid? Yes, you can! You might need some help from an expert outside to come in and help you get going and help facilitate the mapping activity, use the digital tools, lead the Kaizens, and so on. It s a great investment with big payback! Don t skip the fundamentals. Don t think you can jump in halfway up the pyramid. It s not going to work. And I think the lesson today, and this has been my lesson over the years; you need to work within a framework, follow a methodology, but also be innovative, creative, flexible, passionate, and do what you say you re going to do. Be sensitive to the daily lives and the environment of the staff operators. I take it very seriously. I worked a construction job when I was a young man, and it is hard work. I admire and appreciate anyone who comes to work and works their shift, no matter what that job is, maybe in the exact same spot, at the same machine, day after day. I deeply respect that, and I treat people accordingly. The value of good data and then being able to use it and visualize it is so powerful. Don t overwhelm your staff with Lean. Don t roll them over with your Lean implementation! You want to have an aggressive agenda, but we always say, Focus on results, not activity . In other words, focus on the change that you see, focus on the improvement of some of your key metrics, like on-time delivery or inventory or lead time. Don t focus on things such as: We re going to do 25 Kaizens this year, and every manager must be in one Kaizen . That is focusing on activity. It s better to focus on getting results. Use this pyramid if you find it helpful to build your Lean culture. It s not necessarily fully complete, but the big steps are there. And then, I ll leave you with one last tip that I think is important: recognize people! Tell your stories of success, share that, over-share and celebrate, and give a lot of credit and thanks to everyone who is involved, especially the operators. People like to be recognized for doing good things! They like to contribute! Who gets up in the morning and says, Ah, I can t wait to go to work today and waste my time and do a bad job. ? No one does that! People want to contribute! They want to have success. They want to live and work in a successful environment. Let them help you with that, and then give them credit for what they do. This will grow your culture! | ||
 | ||
| Here is my contact information, and you can also find me on my website, www.JohnGaul.com or on LinkedIn. Thank you very much. I look forward to hearing from you! |