The eVSM Software is built on Microsoft Visio and Microsoft Excel and is widely used by lean practitioners worldwide to draw and analyze value stream maps for manufacturing, office, healthcare, and supply network operations. Our software is used by clients large and small, worldwide.
The eVSM Software is the easiest way to draw, analyze, and share value stream maps.
Process-Centric Value Stream Mapping Software
eVSM was designed to be a full lean toolkit that complements and supports your work through the entire continuous improvement cycle. Built-in automation helps you capture your value streams digitally, then analyze key metrics, and helps you manage and evaluate improvement ideas.

eVSM supports the whole continuous improvement cycle
It's Standard Work for Value Stream Mapping
Mapping in eVSM is individually tailored to different industries via standardized stencils, with a common architecture across the tool. These stencils provide a common vocabulary for improvement that everyone in your organization can understand.
 |  |  |  |  |
| Manufacturing | Processing | Transactional | Supply Network | Healthcare |
eVSM now supports Mixed Model mapping, so you can model your processes without having to manually account for product mix. Learn more about Mix.
It's Easy to Get Started
 Get started easily individually or as a team:
 |  |  |
| Free Webinar | On-line Learning and Certification | Classroom Training |
Mistake-Proofing and Automation - Built-In
4x mapping speed and quantified improvements for each map type with a well-designed, complete drawing enviornment.
 |  |  |  |  |
| Complete icon set | Standard Variables | Data Exhange (Excel) | Built-In Equations | Built-In Charts |
Map Your Improvements in eVSM
Listing improvement ideas is easy to do right on your map, with data-rich Problem and Improvement Idea shapes. You can prioritize issues right in eVSM, or export to Excel.
Built-In LEAN Visuals Guide Improvements
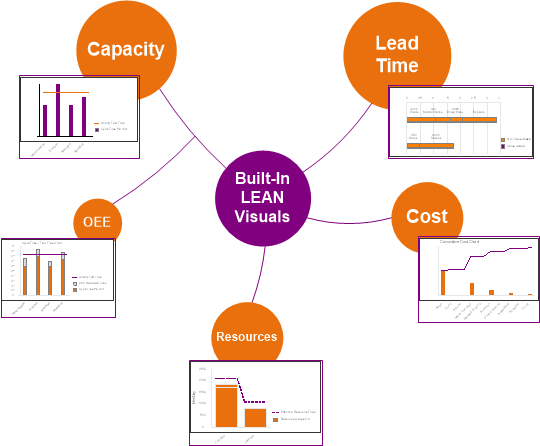
How value stream mapping helps identify and eliminate waste
Value stream mapping (VSM) helps you to visualize every step of a process, meaning a whole team can get a deep understanding of each component. With such a detailed visual representation, teams can pinpoint where inefficiencies and waste occur.
Clarifying Process Steps
This mapping lays out the entire process in a way that is both clear and comprehensive. It allows everyone involved in the process to see the big picture. This clarity helps in distinguishing between steps that genuinely add value and those that don't; this is one of the main points of value stream mapping.
Spotting Wasteful Activities
With a full view of the process, VSM helps identify steps that result in unnecessary resource use—be it time, materials, or effort. This includes identifying actions that lead to excess inventory, prolonged wait times, or unnecessary rework.
Continuous Improvement
Value stream maps are a key part of continuous improvement efforts and operation excellence. By the year, by the quarter, by the week and even the day, teams come back to the digital value stream map and use it as a guide.
So while value stream mapping can be thought of as a diagnostic tool, it's also a roadmap. It's a way to turn complex processes into understandable visuals, that guide the elimination of non-value-added activities and show key areas to focus on.
Basic Steps to Create a Value Stream Map Using Diagramming Software
Start with the Right Template
Begin your value stream map (VSM) by choosing a suitable template or opt for a blank canvas if you prefer a custom approach. Our digital VSM software even allows you to take a photo of your existing wall map to serve as the foundation of your map.
Customize Your Diagram
Add the essential elements to your map by inserting text boxes, shapes, and connecting lines. These will represent the various processes, information flows, and workstations. Ensure each component reflects the necessary details of your value stream.
Refine the Design
What a mixed model value stream map must provide is SPEED (a master VSM, as opposed to lots of individual ones); COMPREHENSION (see shared resources and product variants) and INSIGHTS (robust analytics) .
Utilize Advanced Features
Take advantage of the eVSM software to visualize and manage downtime, changeovers, cycle times, routing. All with a simple drag & drop interface, and integrated with your Excel data.
Collaborate and Share
Once your value stream map is ready, share it with your team. eVSM value stream mapping tools offer collaboration features that allow for real-time updates and feedback.
By following these steps, you can effectively create a comprehensive value stream map that aids in identifying areas for process improvement.