A warm welcome to this preview the book “Leveraging Digital Mixed Model Value Stream Maps”. Its published by Productivity press and available on Amazon sites worldwide
Our aithors have been able to focus over the last two decades just on value stream mapping as a lean methodology and have been involved directly in its deployment at both site and enterprise levels. Our role has been as mapping experts, as coaches to OpEx teams, and in doing hands-on mapping ourselves for critical value streams. This book is the groups third on value stream mapping but the first that directly tackles Mixed Model Value Streams
The book explains what Digital Mixed Model Mapping is, the opportunity it represents, how to evaluate it for your organization, and best practice in its deployment.
This graph depicts the opportunity with Digital Mixed Model Maps. The vertical axis represents product variants made with shared resources. The horizontal axis represents product demand
Traditional value stream mapping with analytics done by hand or with tools such as Visio or Excel alone gets very tedious, once we are outside the low mix/high volume region on the far right. The result is many value stream maps that lack the basic recommended lean analytics (VA/NVA, CT/TT chart, Resource balance chart)
The majority of actual value streams lie in the middle region but this region present some complexities. Lets take a look
The complexities with product variants are in managing different product demands, operational values and routings through shared resources. Its hard to really “see” the value stream clearly without some digital automation to assist. The underlying principles of lean and Theory of Constraints remain important, but are harder to apply
Digital mix model maps allow capture of the value stream with all its product variants, demands, operational values and routings on a single master map. They automate the tedious calculations and generate the critical charts so you can once again “see” the value stream, think about “what-ifs” and properly apply lean principles.
Its an order of magnitude type gain not just in mapping productivity but in selecting the right improvements, and standardizing on high quality maps as birds-eye views of your key value streams. This is the opportunity with Digital Mix VSM. The book discusses how to evaluate this opportunity and effectively deploy the methodology
The book has two purposes. The first is to help evaluate Digital Mix Model VSM as a strategic opportunity and the second to suggest how to deploy it to minimize the adoption lead time and properly support the OpEx team in learning and applying the methodology to maximize its leverage. Both topics require Leadership and OpEx professionals to play a role. Lets discuss these targeted readers a bit more .
Leadership is in the target readership to understand the competitive advantage that Digital Mix VSM can bring and their role in its effective deployment.
Lean practitioners and IE’s need to see how Digital maps are built , have confidence in the metrics displayed and be able to move to a higher level in deploying Lean and TOC (theory of constraints).
Designated Deployment champions are needed to manage the change and they can take advantage of learnings from many such deployments at other organizations.
Finally, we have a digital centric generation emerging from our academic institutions and this is a perfect methodology to give to them so they can learn from simulated .problem solving
Here is the table of contents from the book. Let’s see how the chapters breaks up into the evaluation and deployment purpose of the book
Here are the main parts of the TOC. The first five sections cover evaluation of the Digital Mix VSM methodology from a business and technical perspective. Part V discusses the advantages of digital maps being used more frequently than their paper counterparts in the past
Part six covers the lessons we have learned in deploying this methodology effectively and at scale. I will show excerpts from the book and starting with the evaluation area
The executive summary provides a brief summary of what is Digital Mix VSM and the opportunity it represents in a lean deployment. The section is just a few pages long and is intended as an overview for leadership
Also in the exec summary is a list of evaluation questions that almost everyone asks at the high level looking at this methodology and providing short answers or pointing to areas in the book that cover these.
Once we get past the exec overview, the technical evaluation is supported by a simple case study that you see here. You can see the product variants being produced and the table indicates different operational values for variants at each station. One of the variants has springs so it follows a slightly different routing also
The digital map can be built systematically step by step. The book outlines the steps and then goes through each one with the case study data to build a map. The idea is for the technical evaluation to understand the data clearly and avoid a “black box” mentality that might degrade the map usage and lean thinking that it supports
At the end of these steps, here’s a view of the digital map for the case study. You can see the color coding on the arrows that indicates the two different routes. You can see data ranges in some input data fields that allow product specific values for each variant. The tabs indicate where such input is possible.
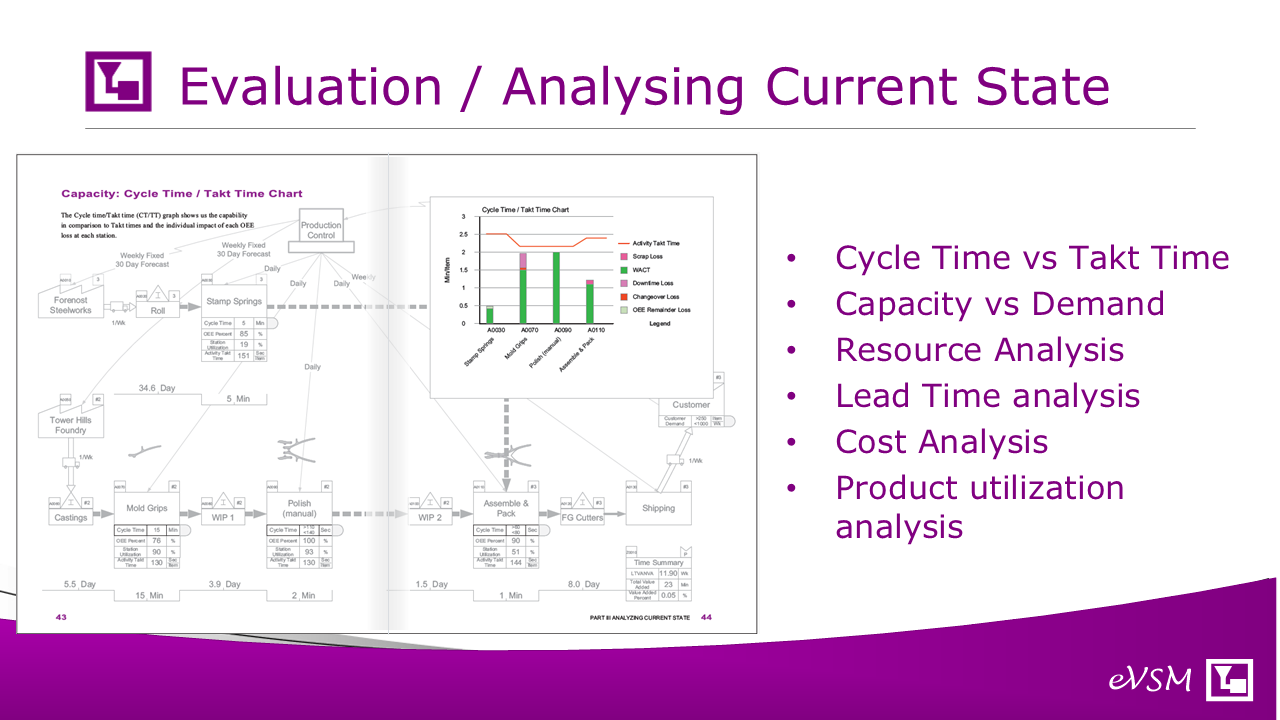
Standard lean equations and charts are built into the digital maps so once the input data is entered, familiar calculations like Takt time, Value added percent are automatically available as are the common charts. The cycle time/takt time chart is show on this page with the red line representing the Takt time and the bars representing the effective cycle time. The colored portions above the green bars represent OEE losses. Lets look at some of the other automated charts..
The digital model can automate production of standard VSM charts. Here’s a few examples.
On the top left is a CT/TT chart. The green bars represent equipment and the purple bars associated staffing.
On the right in the middle is a product utilization chart. It shows station utilization by product variant and useful in providing an intuitive feel of the impact of changes in demand or moving a variant to another line.
At the bottom is a “to scale” depiction of the lead time VA/NVA ladder.
On the top right is an EPEI wheel. This helps with interval planning and shows the relative time taken for production and changeovers in a production interval.
Finally at the bottom is a resource balance chart and shows the time expended in the assigned activities compared to the time available.
Mapping is of course for improvement so you can take advantage of digital support for scoping improvement ideas, approximating impact vs difficulty and even drawing an impact matrix to help decide on what to do next
Traditionally, value stream maps have ben done perhaps once a year at a 3 to 5 day value stream mapping event. The process is typically repeated from scratch each year and there is not much use of the map in between. A digital map is much easier to update and can be used to support decision making around operational scenarios throughout the year. The book has several examples of these as illustration
In this example, there is a request to reduce the cash tied up in the value stream. A map copy can be made and we can explore scenarios involving more frequent deliveries and reduced inventories. The digital map can also do calculations to approximate inventory holding cost, as delivered cost and so on. Enterprise versions of these maps can also simulate the impact on cost of tariffs at points in the value stream
So we have seen samples from the evaluation section of the book, starting with what is Digital Mixed Model VSM, to typical business questions and then a case study to illustrate the technical capability. Digital maps move us to more frequent usage of maps. So called “Living” maps
Next we will look at the deployment aspects of the methodology
In the graphic adapted from the book “Toyota Kata Culture” you see the role of the maps in seeing the current state and establishing a vision for an ideal state. Intermediate maps between these points represent a next target future state. Kata is a coaching based methodology that is structured to foster a problem solving culture and move us along this path. The book has a brief introduction to this and the references point to the Toyota Kata book for further information
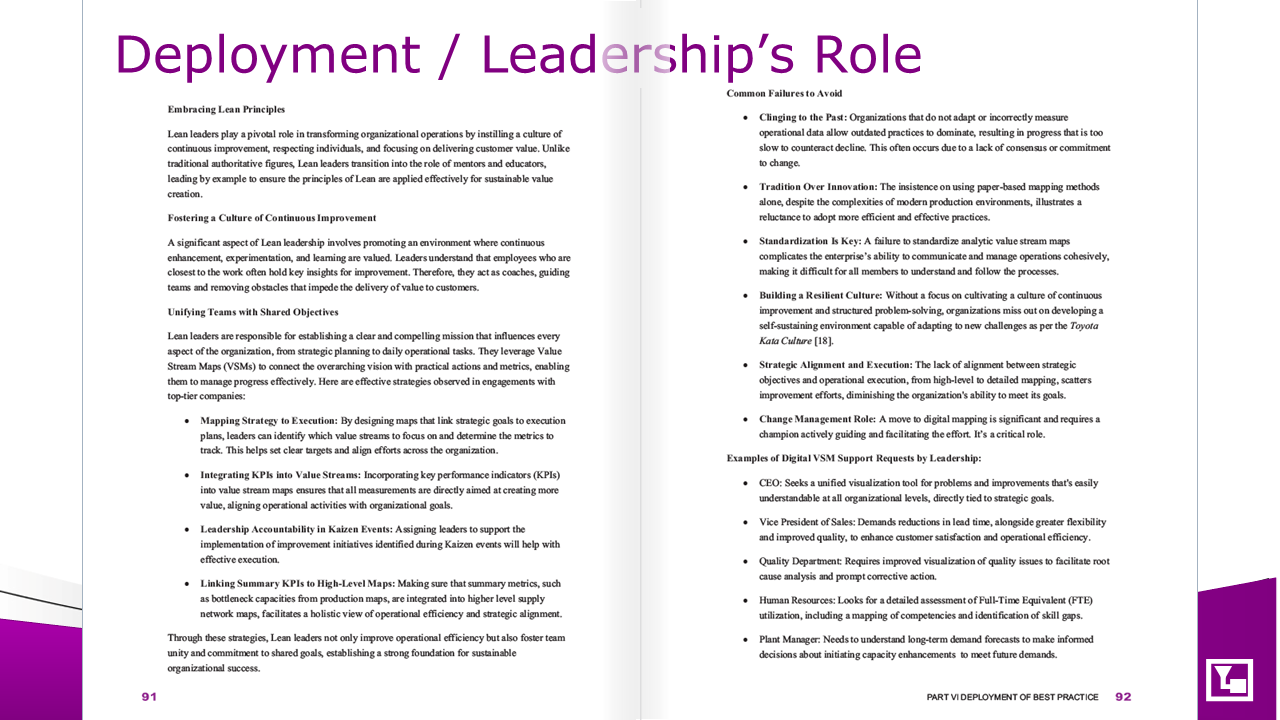
Leadership has a role in evaluating and bringing in the digital methodology. They also have a on-going role in its successful deployment. This section discusses best practices and also common failures to avoid
Digital Mixed Model mapping cannot be learned just by starting to use it. We have established this through experience. There is some formal learning involved to allow us to leverage it in an accelerated fashion. Fortunately this is now available for anytime/anywhere learning. It’s a key piece to allow the methodology to be used across the enterprise. Ideally people just learn what they need to know just before they they use it. It’s a critical piece of deployment and should be part of an organizations overall lean learning program
Imagine you are using this methodology for the first time on an important value stream. Inevitably as a new user you will get stuck. Is it because the methodology does not work or because you don’t know how to work it?. This can be mitigated by almost on-demand coaching with an expert to remove the obstacle. Todays web conference technology is very suitable for this type of virtual coaching. This is a simple brilliant idea
You can’t really write a book in the VSM area and not reference one of the great originals. This is the book “Learning To See”. In deploying Digital Mix methodology, it’s a great idea early on to have people first draw the current state case study map from this publication, do the analysis and compare the results. In doing so they can also brush up on the VSM theory that is the purpose of “Learning to See”
In summary, the book starts with the opportunity with Digital Mix Model Mapping, then discusses how to evaluate it and finishes with how to deploy it based on our experience with the same at many organizations, large and small over the last decade


